Generally, the cryptocurrency market is bearish at the moment, with coins like Avalanche (AVAX), Ethereum, Litecoin, XRP, Solana, and others all caught in this trend. Currently, the price of AVAX is on a strong bearish move below the 100-day Moving Average (MA) and could continue in that direction for a while before retracing.
Technical Indicators Suggest A Bearish Trend For Avalanche
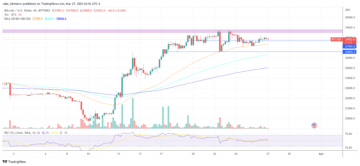
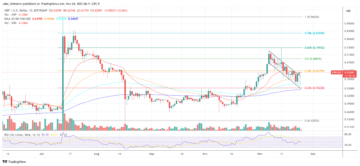
Observing the chart from the 4-hour timeframe, AVAX has crossed below both the 100-day moving average and the trend line. This could mean that the price is on a downward trend. The MACD indicator on the 4-hour timeframe suggests a very strong bearish movement as the MACD histograms are trending below the MACD zero line.
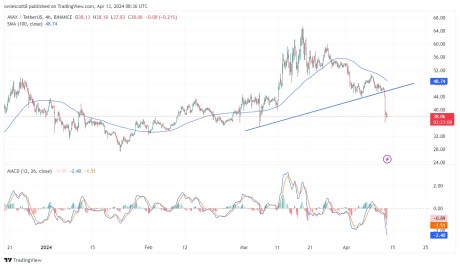
Also, both the MACD line and MACD signal line are trending below the zero line. Given the formation of the MACD indicator, it shows that there is a possibility that the price will still move further downward.
Furthermore, the Relative Strength Index (RSI) also on the 4-hour timeframe suggests a bearish trend as the RSI signal line is trending around the oversold zone. Despite the potential of a retracement at this point, the price will drop more following this.
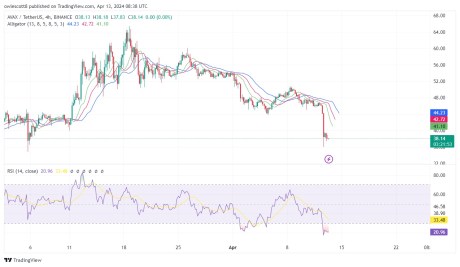
The alligator indicator is another powerful tool used to determine the trend of an asset. A look at the above image shows that both the alligator’s lip and teeth have crossed over the alligator’s jaw facing the downward direction. This formation suggests that the trend is bearish and that the price could witness a deeper decline.
What Could Happen Next
Based on the price’s previous movement, there are two major resistance levels of $50 and $59.99 and a support level of $39.95. As Avalanche is on a negative trajectory, if prices manage to break below the support level of $39.95, it could trigger a move further toward the next low of $27.53.
On the other hand, if the price fails to break below its previous low, it might start an upward correction movement toward the resistance level of $50.80. However, if it manages to break past this level, AVAX might move even further toward the $59.99 resistance level.
As of the time of writing, the Avalanche was trading around $38, indicating a decline of 1.75% in the last 24 hours. Its market cap is down by over 16%, while its trading volume has increased significantly by nearly 250% in the past day.
Featured image from Shutterstock, chart from Tradingview
Disclaimer: The article is provided for educational purposes only. It does not represent the opinions of NewsBTC on whether to buy, sell or hold any investments and naturally investing carries risks. You are advised to conduct your own research before making any investment decisions. Use information provided on this website entirely at your own risk.
- SEO Powered Content & PR Distribution. Get Amplified Today.
- PlatoData.Network Vertical Generative Ai. Empower Yourself. Access Here.
- PlatoAiStream. Web3 Intelligence. Knowledge Amplified. Access Here.
- PlatoESG. Carbon, CleanTech, Energy, Environment, Solar, Waste Management. Access Here.
- PlatoHealth. Biotech and Clinical Trials Intelligence. Access Here.
- Source: https://www.newsbtc.com/analysis/avax/avalanche-avax-downtrend-persists-amid-market-uncertainty/
- :has
- :is
- :not
- 1
- 24
- 39
- 80
- a
- above
- advised
- All
- also
- Amid
- an
- and
- Another
- any
- ARE
- around
- article
- AS
- asset
- At
- Avalanche
- Avalanche (AVAX)
- AVAX
- AVAXUSDT
- average
- bearish
- before
- below
- both
- Break
- buy
- by
- cap
- caught
- Chart
- Coins
- Conduct
- continue
- could
- Crossed
- cryptocurrency
- cryptocurrency market
- Currently
- day
- decisions
- Decline
- deeper
- Despite
- Determine
- direction
- does
- down
- downward
- Drop
- educational
- entirely
- Even
- facing
- fails
- following
- For
- formation
- from
- further
- given
- hand
- happen
- Have
- hold
- HOURS
- However
- HTTPS
- if
- image
- in
- increased
- index
- indicating
- Indicator
- Indicators
- information
- investing
- investment
- Investments
- IT
- ITS
- jpeg
- Last
- Level
- levels
- like
- Line
- Litecoin
- Look
- Low
- MACD
- major
- Making
- manage
- manages
- Market
- Market Cap
- max-width
- mean
- might
- moment
- more
- move
- movement
- moving
- moving average
- naturally
- nearly
- negative
- NewsBTC
- next
- of
- on
- only
- Opinions
- or
- Other
- Others
- over
- own
- past
- persists
- plato
- Plato Data Intelligence
- PlatoData
- Point
- possibility
- potential
- powerful
- previous
- price
- Prices
- provided
- purposes
- relative
- relative strength index
- Relative Strength Index (RSI)
- represent
- research
- Resistance
- retracement
- Risk
- risks
- rsi
- sell
- Shows
- shutterstock
- Signal
- significantly
- Source
- start
- Still
- strength
- strong
- suggest
- Suggests
- support
- support level
- that
- The
- There.
- this
- time
- timeframe
- to
- tool
- toward
- Trading
- trading volume
- TradingView
- trajectory
- Trend
- trending
- trigger
- two
- Uncertainty
- upward
- use
- used
- very
- volume
- was
- Website
- whether
- while
- will
- with
- witness
- writing
- xrp
- you
- Your
- zephyrnet
- zero
- zone