Published 6 hours ago
Amid the January 2023 rally, the Binance coin witnessed a V-shaped recovery. The shape of the recovery reflects the speed and strength of the bounce back, and the vertical part of the “V” symbolizes rapid recovery. However, the increasing negative and US SEC’s recent probe against Paxos Trust Co, the issuer of Binance USD (BUSD) triggered a prolonged downfall. Here are the levels the BNB holders should watch for.
advertisement
Key Points:
- A massive breakdown from $300 support sets Binance coin price for a further downfall
- The RSI indicator slope diving deeper into the bearish territory indicates the negative sentiment among participants rising.
- The intraday trading volume in the BNB coin is $1.26 Billion, indicating a 196% gain
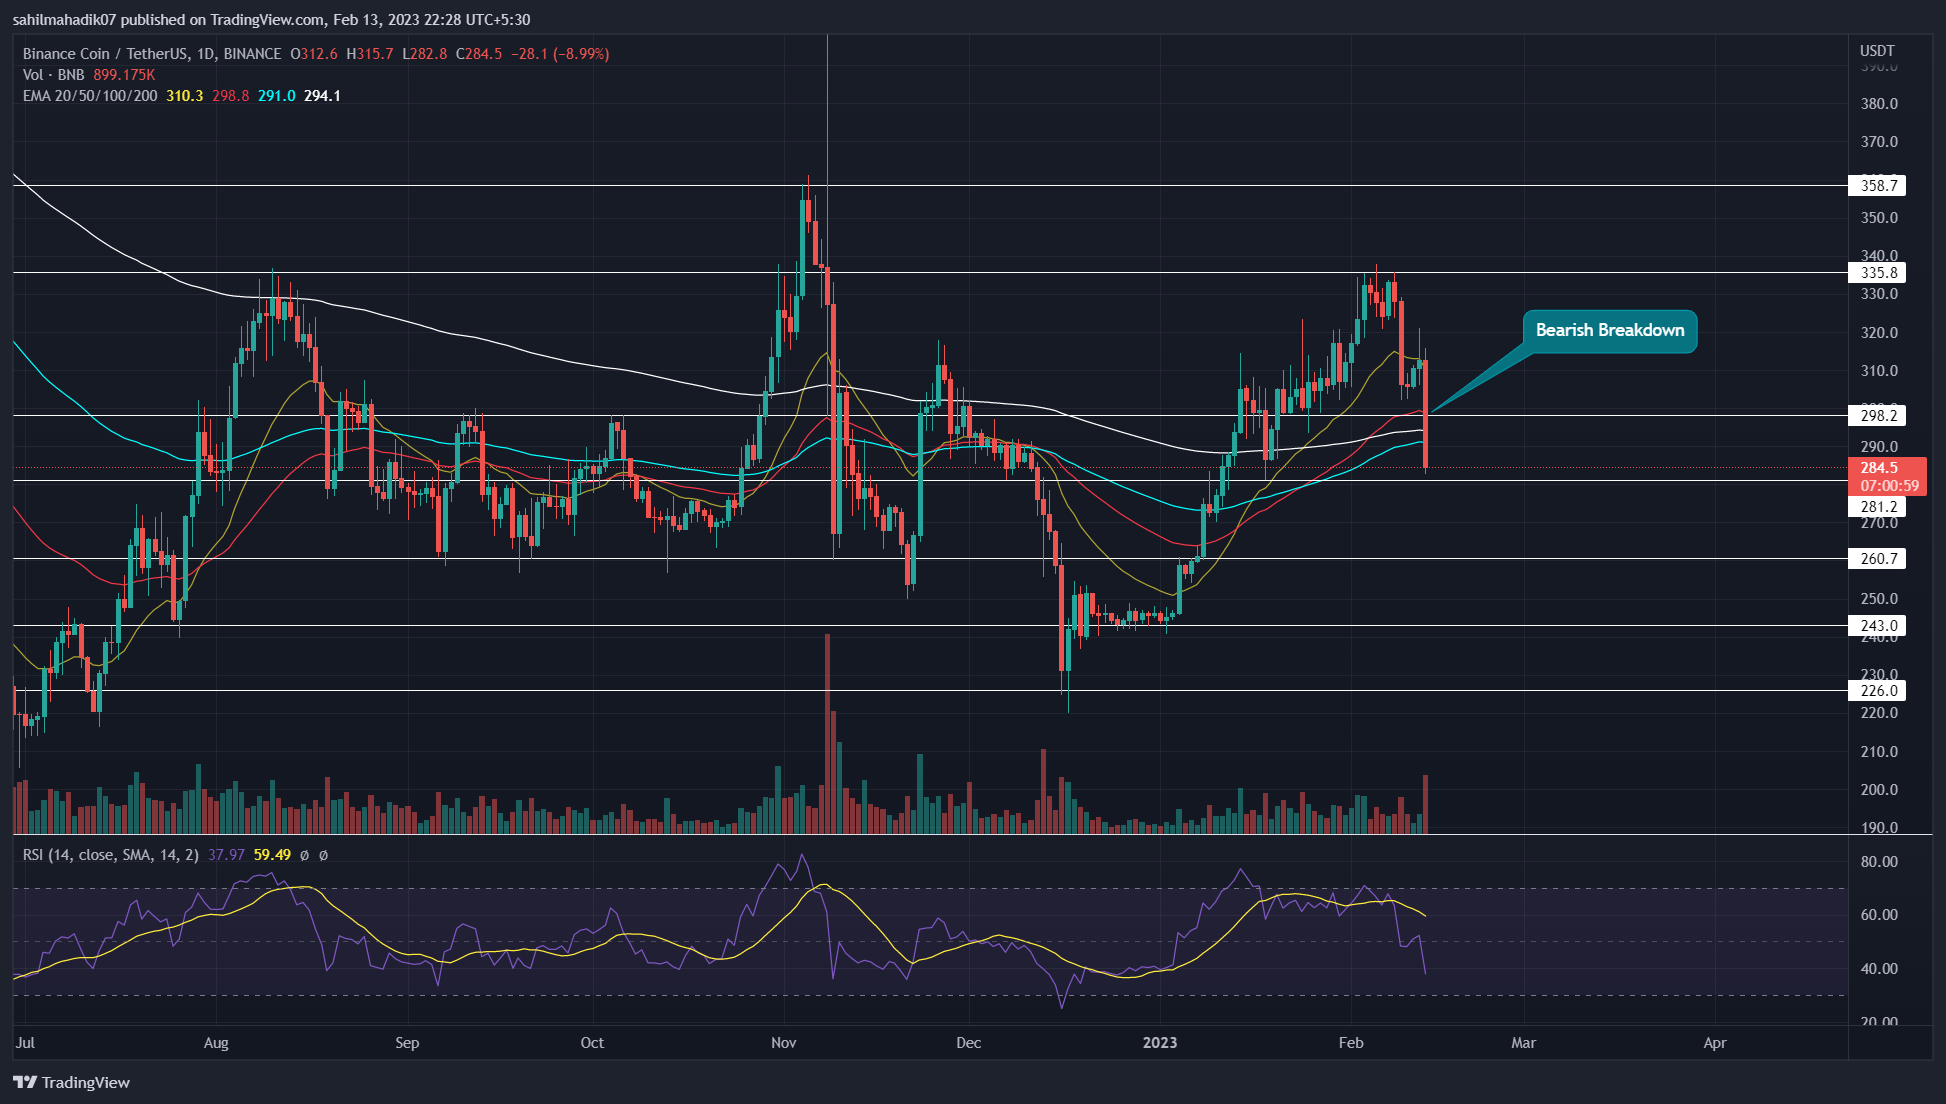
Source- Tradingview
Amid the ongoing correction phase in the crypto market, the BNB price turned down from the local top of $335. This downfall tumbled the coin’s market value by 14% in the last six days and pushed its current price to the $287 mark.
However, today’s price movement contributed significantly as the Binance coin is down 8% on the intraday level. This sudden selling in the market could be triggered by the US SEC probe against Paxos Trust Co, accusing the Binance USD(BUSD) stable coin as an unregistered security. As a result, this claim caused a sharp panic selling in the BNB price and plunged it below the psychological support of $300.
Trending Stories
Also Read: CRYPTO TELEGRAM CHANNELS LIST 2023
The long-bearish candle with high volume indicates the traders are aggressively selling the Binance coin. Thus a candle closing below the $300 mark, may offer sellers a strong resistance level to bolster future price fall.
However, the coin price may revert back to retest the $300 mark as a potential resistance. If the price shows sustainability below the aforementioned level, the coin may plunge to the following support of $281, $260, or $243.
Technical Indicators
Relative strength index: A shaped decline in the daily RSI slope below the midline accentuates the strong selling pressure in the market.
advertisement
EMAs: the falling BNB price breached the crucial EMAs support(20, 50, 100, and 200) offering an extra edge in the seller’s favor.
Binance Coin Price Intraday Levels
- Spot rate: $285.4
- Trend: Bearish
- Volatility: Low
- Resistance level- $300 $335
- Support level- $281 and $260
Share this article on:
The presented content may include the personal opinion of the author and is subject to market condition. Do your market research before investing in cryptocurrencies. The author or the publication does not hold any responsibility for your personal financial loss.
- SEO Powered Content & PR Distribution. Get Amplified Today.
- Platoblockchain. Web3 Metaverse Intelligence. Knowledge Amplified. Access Here.
- Source: https://coingape.com/markets/binance-coin-dips-by-9-how-long-may-this-correction-phase-last/
- 1
- 10
- 100
- 2023
- 7
- 9
- a
- Ad
- against
- among
- and
- article
- author
- avatar
- back
- bearish
- Beauty
- before
- below
- Billion
- binance
- Binance Coin
- Binance Coin Price
- Binance USD (BUSD)
- blockchain
- bnb
- BNB coin
- BNB Price
- bolster
- Bounce
- Breakdown
- Brian
- burn
- BUSD
- caused
- channels
- claim
- closing
- Coin
- Coingape
- COM
- condition
- content
- contributed
- correction phase
- could
- crucial
- crypto
- Crypto Market
- cryptocurrencies
- cryptocurrency
- Current
- daily
- Days
- Decline
- deeper
- different
- down
- downfall
- Edge
- Entertainment
- Ether (ETH)
- extra
- Fall
- Falling
- Fashion
- favor
- finance
- financial
- follow
- following
- from
- further
- future
- Future Price
- here
- High
- hold
- holders
- HOURS
- How
- However
- HTTPS
- in
- include
- Including
- increasing
- index
- indicates
- Indicator
- investing
- Issuer
- IT
- January
- journalism
- Last
- Level
- levels
- List
- local
- Long
- loss
- mark
- Market
- market research
- massive
- movement
- negative
- offer
- offering
- ongoing
- Opinion
- Panic
- part
- participants
- past
- Paxos
- personal
- phase
- plato
- Plato Data Intelligence
- PlatoData
- plugin
- plunge
- points
- potential
- presented
- pressure
- price
- probe
- Publication
- pushed
- rally
- rapid
- Rate
- Read
- recent
- recovery
- reflects
- research
- Resistance
- responsibility
- result
- revert
- rising
- rsi
- SEC
- security
- Sellers
- Selling
- sentiment
- Sets
- Shape
- shaped
- Share
- sharp
- should
- Shows
- significantly
- SIX
- Slope
- speed
- stable
- stable coin
- strength
- strong
- subject
- sudden
- support
- Sustainability
- Telegram
- The
- to
- today’s
- top
- Topics
- Traders
- Trading
- trading volume
- TradingView
- trending
- triggered
- Trust
- Turned
- unregistered
- us
- US Sec
- USD
- value
- variety
- volume
- Watch
- witnessed
- working
- written
- years
- Your
- zephyrnet