Disclaimer: The findings of the following article are the sole opinions of the writer and should not be taken as investment advice
The global cryptocurrency market, led by Bitcoin, has been quite topsy-turvy over the past couple of months. While there have been several recovery attempts since the 19 May sell-off, most altcoins have been unable to hold on to higher levels on their respective charts. The latest revival attempt came in late June when the market gained some upwards momentum. However, the same was eventually negated by constant waves of selling pressure.
Binance Coin, unlike most of its counterparts, was able to sustain its uptrend. That being said, the formation of an up-channel did give rise to some concerns with respect to its long-term trajectory. At the time of writing, BNB was being traded at $306, down by 3.5% over the last 24 hours.
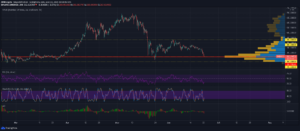
Binance Coin Daily Chart

Source: BNB/USD, TradingView
After dropping to a low of $224.8 on 22 June, buyers re-entered the BNB market and kickstarted an uptrend. This led to the formation of an uptrend as BNB eventually reclaimed the region above its 38.2% Fibonacci Extension around $310. However, the 50-SMA (yellow) and 50% Extension level ($336.3) formed a strong resistance zone and denied any further upside.
At press time, the alt’s price was testing the 38.2% Extension, with downwards pressure yet to be relieved. Ergo, BNB would likely see lower levels over the next few days. A key support area rested at the 23.6% Extension at $277.4, a level which interestingly, was close to the Visible Range’s Point of Control.
Reasoning
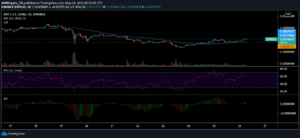
The Squeeze Momentum Indicator suggested that bullish momentum was on a decline, as denoted by its declining green bars. While the market was in a current squeeze and indicated that BNB would steadily decline as opposed to a sharp sell-off, losses could amplify once volatility picks up.
The Relative Strength Index has been trading close to equilibrium over the past 9 days, but the fact that it was unable to rise above 50-55 was a sign of weakness. The MACD closed in on a bearish crossover as buying pressure gradually receded on the charts.
Conclusion
The aforementioned factors are worrying signs for BNB and a close below the $290-level and 200-SMA (green) could trigger the next sell-off – A development that could drag the price towards its 23.6% Fibonacci Extension before bouncing back. Meanwhile, traders can wait for temporary recovery and enter a short trade at BNB’s 50% Fibonacci extension of $336 and exit their positions at the Visible Range’s POC of $260.
Where to Invest?
Subscribe to our latest Crypto News and Analysis below :
Source: https://ambcrypto.com/binance-coin-heres-how-traders-can-short-this-pattern/
- 7
- 9
- Altcoins
- analysis
- AREA
- around
- article
- bars
- bearish
- binance
- Binance Coin
- Bitcoin
- bnb
- Bullish
- Buying
- Charts
- closed
- Coin
- Container
- Couple
- crypto
- Crypto News
- cryptocurrency
- cryptocurrency market
- Current
- Development
- DID
- Exit
- Global
- Green
- hold
- How
- HTTPS
- index
- investment
- IT
- Key
- latest
- Led
- Level
- Market
- Momentum
- months
- news
- Opinions
- Pattern
- PoC
- press
- pressure
- price
- recovery
- Short
- Signs
- support
- temporary
- Testing
- time
- trade
- Traders
- Trading
- Volatility
- wait
- waves
- writer
- writing