TL;DR Breakdown
- Binance Coin price expected to observe correction at $450
- BNB faces resistance at the $480 mark
- The closest support level lies at the $420 mark
The Binance Coin price has broken above the $450 key level as the bulls continue guiding the cryptocurrency’s price action. BNB finds strong support at the $420 level that supports the asset’s upwards movement towards the $500 mark.
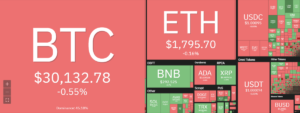
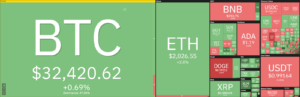
The broader cryptocurrency observes a bullish market sentiment over the last 24-hours as most major cryptocurrencies record positive movements over the period. Major players include Avalanche and ICON recording a 25.15 and a 15.55 percent incline, respectively.
Technical indicators for BNB/USDT: Can BNB break past $450?
Across the technical indicators, the MACD histogram is green and shows strong bullish momentum at press time, as expressed by the tall green bars. The momentum has only increased in the recent hours as the Binance Coin price broke above the $450 key resistance level. While both EMAs continue rising, the 12-EMA is rising with a much steeper slope suggesting further bullish divergence as buyers continue the bullish rally.
The RSI is currently trading on the edge of the neutral territory. The indicator currently hovers around the 69.00 index level showing strong bullish dominance over the Binance Coin market. However, the indicator’s high position suggests that the Binance Coin price does not have much more room for upwards movement in the short term. As such, further bullish movement would cause a correction at the level.
The Bollinger Bands are currently wide and show further expansion as BNB breaches the indicator’s upper limit. The extremely wide position of the bands suggests high volatility for BNB which can be expected to continue rising as the sharp bullish movement leaves the price action unstable.
Overall, the 4-hour technical analysis issues a buy signal showing bullish strength at the current price level. The analysis shows 16 of the 26 major technical indicators in support of an upwards movement for the Binance Coin price. On the other hand, only one of the indicators issues a sell signal, suggesting a low bearish presence at the current level. Meanwhile, the remaining nine indicators sit on the fence and do not issue any signals supporting either side of the market.
The 24-hour technical analysis accentuates this sentiment, issuing a strong buy signal showing a positive outlook for the Binance Coin price action across the mid-term charts. The analysis shows 17 indicators suggesting further upwards movement for the Binance Coin price action against a single indicator suggesting a downward price movement. Meanwhile, eight indicators remain neutral at the time of writing.
What to expect from the Binance Coin price?
Traders should expect the Binance Coin price to face resistance in leaving the $450 mark as the price moves upwards. While the mid-term technical analyses suggest that the bulls would continue controlling the markets, the short-term technical indicators suggest a correction at the current price level before BNB moves towards the $500 mark. As such, traders should expect a drop to $420, with further downwards movement being unlikely.
However, if the price does not observe a correction and continues towards the $500 mark, there is little chance of breaking past $500, and the price action would stagnate at the level losing its momentum.
Source: https://api.follow.it/track-rss-story-click/v3/tHfgumto13Aa1ZRpFVZmVem6srrLMsqK
- Action
- analysis
- around
- Avalanche
- bars
- bearish
- binance
- Binance Coin
- bnb
- breaches
- Bullish
- Bulls
- buy
- Cause
- Charts
- Coin
- continue
- continues
- crypto
- cryptocurrencies
- cryptocurrency
- Current
- Edge
- expansion
- Face
- faces
- finds
- Green
- High
- HTTPS
- ICON
- index
- issues
- Key
- Level
- major
- mark
- Market
- Markets
- Momentum
- Other
- Outlook
- press
- price
- Price Analysis
- rally
- sell
- sentiment
- Short
- support
- support level
- Supports
- Technical
- Technical Analysis
- time
- Traders
- Trading
- Volatility
- writing