TL;DR Breakdown
- Binance coin price analysis on the 4-hour chart shows positive signals
- BNB/USD is firmly floating above the 200-day SMA
- The cryptocurrency market has seen slight gains over the past 24 hours.
- Bollinger bands are further contracting towards the 12-hour trading chart
Binance Coin Price Analysis: General price overview
From the beginning of May to the end, Binance Coin’s price plummeted 70% from the 52-weeks high at $692.62 on May 3 to $210.95 on May 23.
Unlike most other cryptocurrencies, BNB managed to stay above the support level marked by the 200-day moving average.
This strong line allowed it to rise again over time and initiate new rallies that market analysts predict will reduce losses in the coin’s recent spiral down since reaching an all-time high last month.
During press time, Binance Coin is already up by 25 percent from the $300 level and struggling with resistance at $355. The overhead target lies between $374 – $379. Significant selling pressure lies beneath these targets and poses the biggest hurdle between the press time price and BNB rallying back to its ATH.
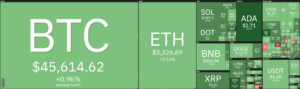
The cryptocurrency market has seen slight gains over the past 24 hours. Bitcoin and Ethereum both decreased by over 5 percent, while most of the other coins were up as well.
Uniswap, Litecoin, and Chainlink are the hottest gainers after going up by 12, 10, and 7 percent, respectively.
Fresh Binance Exchange entrant C98 is the worst performing altcoin on the daily chart, with up to 6 percent losses.
Binance Coin price movement in the last 24 hours
The BNB/USD pair price traded between $348 and $356 over the last 24 hours. This is a tight daily range with a difference of only 8 points. The trading volume was 16.09% more than it was the previous day, with a total daily trading volume of $1.66 billion. On the other hand, the total market capitalization surged by 3.48 percent to a whopping $59 billion.
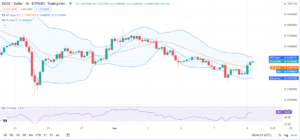
Bollinger bands are further contracting towards the 12-hour trading chart, suggesting decreasing volatility on the Binance Coin price analysis.
Binance Coin 4-hour price analysis
Binance coin price analysis on the 4-hour chart shows positive signals of breaking out a supply zone that’s been holding the price hostage between $350 and $351. The upper Bollinger band, which marks the 100 moving average, is located at $362, a primary target for the bulls as they clear a rally towards $370.
A bullish Golden Cross pattern on the six-hour chart highlights the potential for a crucial Binance Coin price movement. This pattern should occur when the 50 six-hour SMA crosses above the 200 six-hour SMA, in addition. Historically, it happened when Binance rallied in April from its November 2020 lows.
However, if the coin price will not pass the $355 price hurdle, a high chance exists of correcting below $350. As of this writing, Binance Coin is trading at $352.
Binance Coin Price Analysis Conclusion
Binance Coin is facing many fundamental challenges for the foreseeable future, including tight regulations of its parent exchange. However, there are a number of predicted turns it could take. The main target is $379, and after breaking out of the $300 psychological resistance late last week, the bulls are likely to hit their target between now and next week.
Disclaimer. The information provided is not trading advice. Cryptopolitan.com holds no liability for any investments made based on the information provided on this page. We strongly recommend independent research and/or consultation with a qualified professional before making any investment decisions. Source: https://www.cryptopolitan.com/binance-coin-price-analysis-2021-08-10/
- 100
- 2020
- 7
- advice
- analysis
- April
- Biggest
- Billion
- binance
- Binance Coin
- bnb
- Bullish
- Bulls
- capitalization
- Coin
- Coins
- cryptocurrencies
- cryptocurrency
- cryptocurrency market
- day
- exchange
- facing
- future
- General
- High
- HTTPS
- Including
- information
- investment
- Investments
- IT
- Level
- liability
- Line
- Making
- Market
- Market Capitalization
- Other
- Pattern
- press
- pressure
- price
- Price Analysis
- rally
- range
- reduce
- regulations
- research
- stay
- supply
- support
- support level
- Target
- time
- Trading
- Volatility
- volume
- week
- writing