Bitcoin (BTC) surfed $34,000 at the Oct. 27 Wall Street open as attention turned to BTC price performance against macro assets.
Bitcoin range faces weekly, monthly close
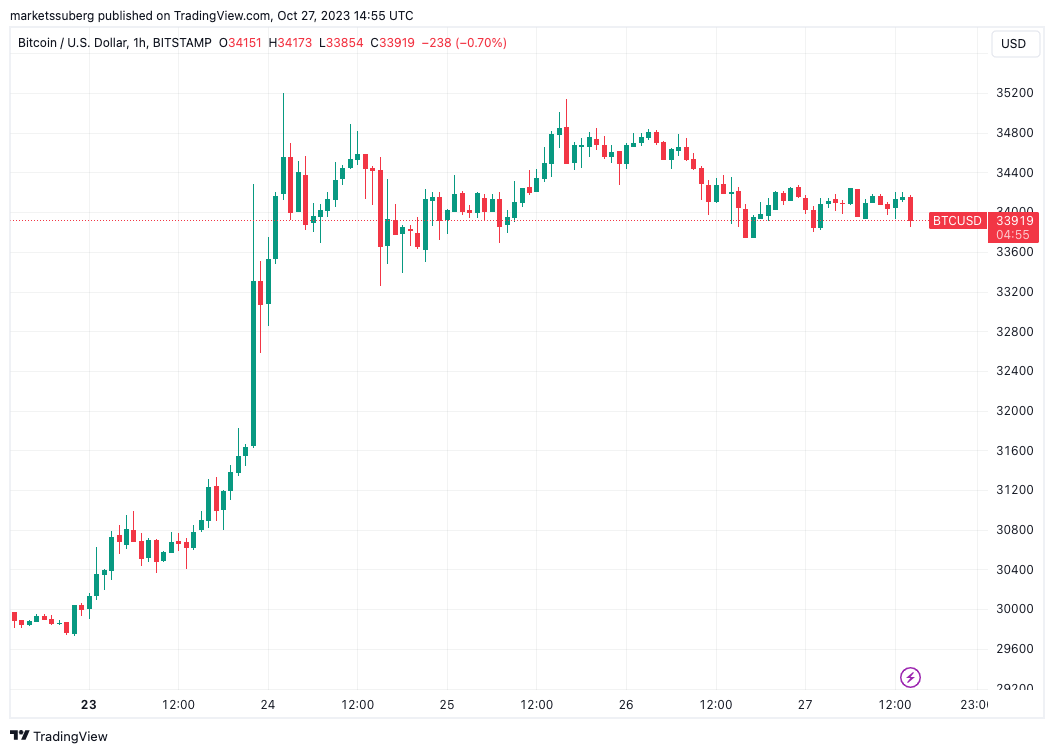
Data from Cointelegraph Markets Pro and TradingView showed BTC/USD holding steady, preserving its early-week gains.
The largest cryptocurrency avoided significant volatility as the weekly and monthly closes — a key moment for the October uptrend — drew ever nearer.
“I think Bitcoin will hang around this range for some time,” popular trader Daan Crypto Trades told X subscribers in one of several posts on the day.
“Roughly $33-35K is what I’m looking at as a range. Eyes on potential sweeps of any of these levels for a quick trade.”

Daan nonetheless noted that open interest (OI) had recovered near levels last seen before the sudden uptick, which sent Bitcoin to 17-month highs. As Cointelegraph reported, open interest highs had formed a feature of BTC price “squeezes” during prior weeks.
#Bitcoin Open Interest on Bybit has almost recovered to the level before the massive short squeeze this week.
During that squeeze, we saw a 21% decrease in Open Interest on Bybit which was worth ~$450M pic.twitter.com/YbCM6XWZHW
— Daan Crypto Trades (@DaanCrypto) October 27, 2023
Elsewhere, on-chain monitoring resource Material Indicators flagged a downside signal on one of its proprietary trading instruments.
With two such daily signals in place, Material Indicators said that only a move to $38,850 would “invalidate” the bearish implication.
“That doesn’t mean we can’t go there before the Monthly candle close,” part of X commentary reasoned.
Trend Precognition continues to show the way.
For me, a move above $34,850 invalidates on the D chart. That doesn’t mean we can’t go there before the Monthly candle close.
If you want to get these #TradingSignals when they are actionable, subscribe.
Get the tools. Gain the… pic.twitter.com/bpOomEv5Tq
— Material Indicators (@MI_Algos) October 27, 2023
Analysis: “Plenty of fuel” to send BTC price to $40,000
More optimistic perspectives came from macroeconomic comparisons.
Related: Bitcoin restarting 2023 uptrend after 26% Uptober BTC price gains — Research
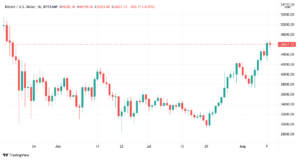
Popular social media trader Kaleo noted that Bitcoin had outperformed the S&P 500 considerably since September, with the odds of continued BTC price upside still good as a result.
“Over the course of the past month, we’ve finally seen ‘the bullish decoupling’ for BTC from equities that everyone was waiting for,” he wrote in part of the day’s commentary.
“While BTC is up only 36% vs USD from the September lows, BTC is up 48% vs. SPX.”

An accompanying chart showed BTC/USD versus the S&P500, with key recent events in Bitcoin’s history marked. Kaleo argued that there was “plenty of fuel left in the tank for a move higher to $40K.”
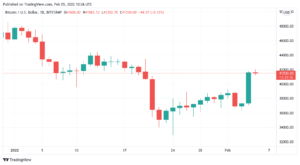
Others focused on the significance of recent resistance levels being within days of flipping to weekly and monthly support.
“Not sure how anyone could look at this Bitcoin chart objectively and conclude that breaking through $32k is no big deal,” crypto and macro analyst Matthew Hyland argued.
Hyland suggested that bears had few options left open.
“The last line of hope for them is the weekly & monthly closing below,” he concluded.
This article does not contain investment advice or recommendations. Every investment and trading move involves risk, and readers should conduct their own research when making a decision.
- SEO Powered Content & PR Distribution. Get Amplified Today.
- PlatoData.Network Vertical Generative Ai. Empower Yourself. Access Here.
- PlatoAiStream. Web3 Intelligence. Knowledge Amplified. Access Here.
- PlatoESG. Carbon, CleanTech, Energy, Environment, Solar, Waste Management. Access Here.
- PlatoHealth. Biotech and Clinical Trials Intelligence. Access Here.
- Source: https://cointelegraph.com/news/bitcoin-beats-sp500-october-40k-btc-price-predictions
- :has
- :is
- :not
- ][p
- $UP
- 000
- 12
- 2023
- 27
- 500
- 8
- a
- above
- advice
- After
- against
- almost
- analyst
- and
- any
- anyone
- ARE
- argued
- around
- article
- AS
- Assets
- At
- attention
- avoided
- bearish
- Bears
- before
- being
- below
- Big
- Bitcoin
- Breaking
- BTC
- btc price
- BTC/USD
- Bullish
- Bybit
- came
- Chart
- Close
- Closes
- closing
- Cointelegraph
- Commentary
- comparisons
- conclude
- concluded
- Conduct
- considerably
- contain
- continued
- continues
- could
- course
- crypto
- cryptocurrency
- daily
- day
- Days
- deal
- decision
- decrease
- does
- Doesn’t
- downside
- during
- Equities
- Ether (ETH)
- events
- EVER
- Every
- everyone
- Eyes
- faces
- Feature
- few
- Finally
- flagged
- flow
- focused
- For
- formed
- from
- Fuel
- Gain
- Gains
- get
- Go
- good
- had
- Hang
- he
- higher
- Highs
- history
- holding
- hope
- How
- HTTPS
- i
- in
- Indicators
- instruments
- interest
- investment
- involves
- ITS
- Kaleo
- Key
- largest
- Last
- left
- Level
- levels
- Line
- Look
- looking
- Lows
- Macro
- Macroeconomic
- Making
- marked
- Markets
- massive
- material
- matthew
- me
- mean
- Media
- moment
- monitoring
- Month
- monthly
- move
- Near
- no
- noted
- objectively
- Oct
- october
- Odds
- of
- on
- On-Chain
- ONE
- only
- open
- open interest
- Optimistic
- Options
- or
- outperformed
- own
- part
- past
- performance
- perspectives
- Place
- plato
- Plato Data Intelligence
- PlatoData
- Plenty
- Popular
- Posts
- potential
- Predictions
- preserving
- price
- Prior
- proprietary
- Quick
- range
- readers
- recent
- recommendations
- research
- Resistance
- resource
- result
- Risk
- S&P
- S&P 500
- S&P500
- Said
- saw
- seen
- send
- sent
- September
- several
- Short
- short squeeze
- should
- show
- showed
- Signal
- signals
- significance
- significant
- since
- Social
- social media
- some
- Source
- spx
- Squeeze
- steady
- Still
- street
- subscribe
- subscribers
- such
- sudden
- support
- sure
- tank
- that
- The
- The Weekly
- their
- Them
- There.
- These
- they
- Think
- this
- this week
- Through
- time
- to
- tools
- trade
- trader
- trades
- Trading
- TradingView
- Turned
- two
- Upside
- uptrend
- USD
- Ve
- Versus
- Volatility
- vs
- Waiting
- Wall
- Wall Street
- want
- was
- Way..
- we
- week
- weekly
- Weeks
- What
- when
- which
- will
- with
- within
- worth
- would
- X
- you
- zephyrnet