A look at on-chain indicators for Bitcoin (BTC), more specifically the Hash Ribbon and the Difficulty Ribbon Compression, in order to determine the health of the market from the miners’ perspective.
The Hash Ribbon moving averages (MA) have made a bullish cross, potentially suggesting that the period of miner capitulation has reached its end. The Difficulty Ribbon Compression has moved above 0.05, further confirming this possibility.
Hash Ribbon
The Hash rate measures the computing power that is contributed to the network by BTC miners. In order to mine a block, mining machines solve complex calculations. The higher the hash rate, the higher the number of such calculations done per second.
The Hash ribbon makes use of the hash rate to determine if miners are capitulating. Miner capitulation is considered the period in which mining costs are higher than rewards. In the graph below, they are denoted by light and dark red colors.
Historically, these periods have been usually associated with either local or absolute bottoms.


The indicators also uses a 30- and 60-day MA for the hash rate, in order to determine when these periods of capitulation come to an end.
A bullish cross transpired on Aug 9, as seen by the shift from a light to a darker red color.

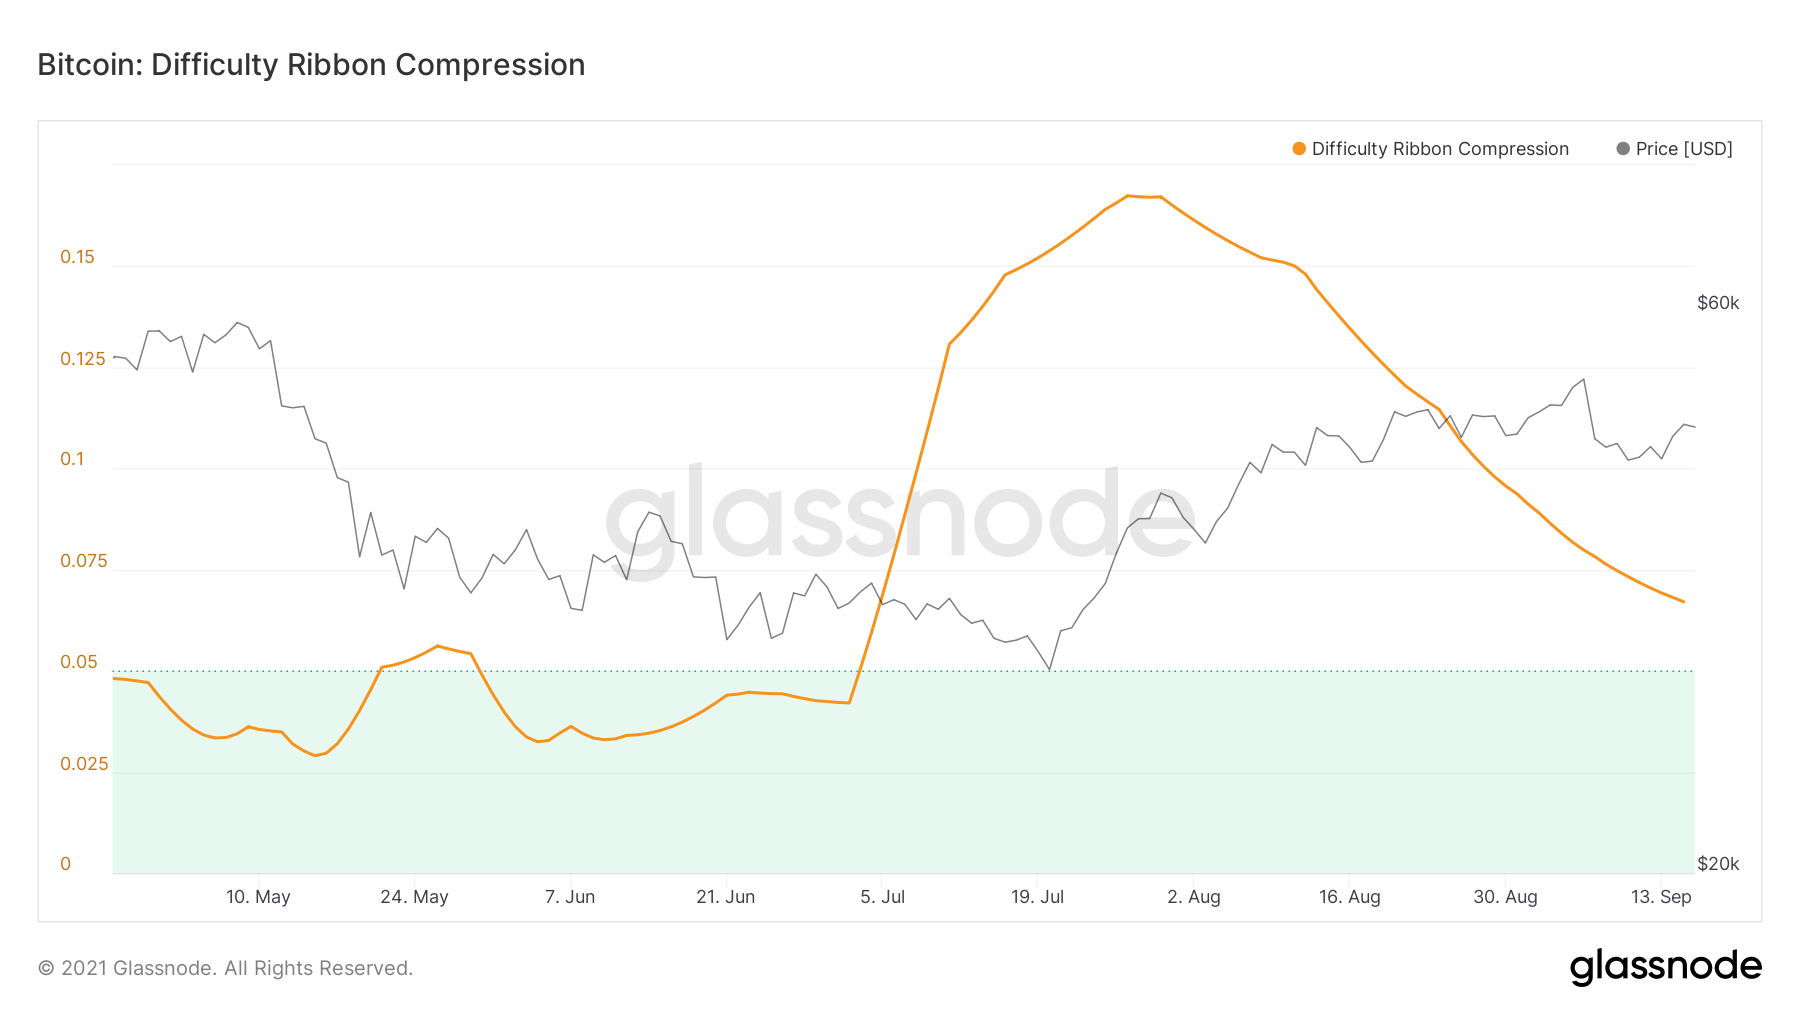
BTC Difficulty Compression
The mining difficulty estimates how many hashes are required in order to mine one block. It is adjusted every 2016 blocks, which means once every two weeks.
Therefore, this adjustment lags the hash rate by two weeks, since the latter is calculated daily.
The Difficulty Ribbon Compression indicators make use of a standard deviation in order to better quantify difficulty ribbon values. A low value (between 0.01-0.05) has usually indicated that a bottom has been reached, using a normalized standard deviation in order to quantify the values given by the difficulty ribbon. Low values (those between 0.01 and 0.05) have historically represented periods close to the bottom.

The indicator has been increasing since the beginning of July and reached a high of 0.167 on July 28. While it has been falling since, it is still above the 0.05 upper limit threshold.
For BeInCrypto’s latest Bitcoin (BTC) analysis, click here.
Disclaimer
All the information contained on our website is published in good faith and for general information purposes only. Any action the reader takes upon the information found on our website is strictly at their own risk.
- 2016
- 9
- Absolute
- Action
- All
- analysis
- analyst
- barcelona
- Bitcoin
- BTC
- Bullish
- computing
- computing power
- contributed
- Costs
- cryptocurrencies
- cryptocurrency
- data
- discovered
- Economics
- estimates
- financial
- General
- Glassnode
- good
- graduate
- hash
- hash rate
- Health
- High
- How
- HTTPS
- information
- IT
- July
- light
- local
- Machines
- Market
- Markets
- Miners
- Mining
- mining machines
- network
- order
- perspective
- power
- Reader
- Rewards
- Risk
- School
- shift
- SOLVE
- value
- Website
- websites
- writing