- BTC price is up 25% over the past month
- 20MA has acted as support since the bottom in July
- BTC Price has formed a curve which shows breakout in 1 week or less
Bitcoin (BTC) price has been having trouble tackling the $50,000 mark over the last 2 weeks. After prices surged off the bottom of $29,000, BTC managed to rise nearly 75% in less than a month. Since then, BTC price has been steady within a $5,000 range which has allowed many alt coins to surge past their ATHs. The overall market is still showing bullish signs as many investors are anticipating a push over $50,000 to happen fairly soon.
On the daily timeframe, BTC price looks overextended but this does not negate the possibility of a surge to $55,000 before a larger pullback occurs.
As BTC price has risen over the last month, each top it has put in has became less parabolic. This BTC price action has formed a curved top along with a curved bottom over the past 35 days (shown in black). The end of this formation is within a week & BTC is expected to have a large breakout sometime before then. It is hard to say whether this is a bullish or bearish pattern but we can use each curve as a reference.
BTC price must break & hold the major resistance zone found at $48,000-$50,200 to experience a large push to the upside. In the case bulls manage to pull this off, expect BTC to reach $53,300 & potentially $56,530.
Bitcoin Price Analysis: BTC/USDT 1 Day Chart
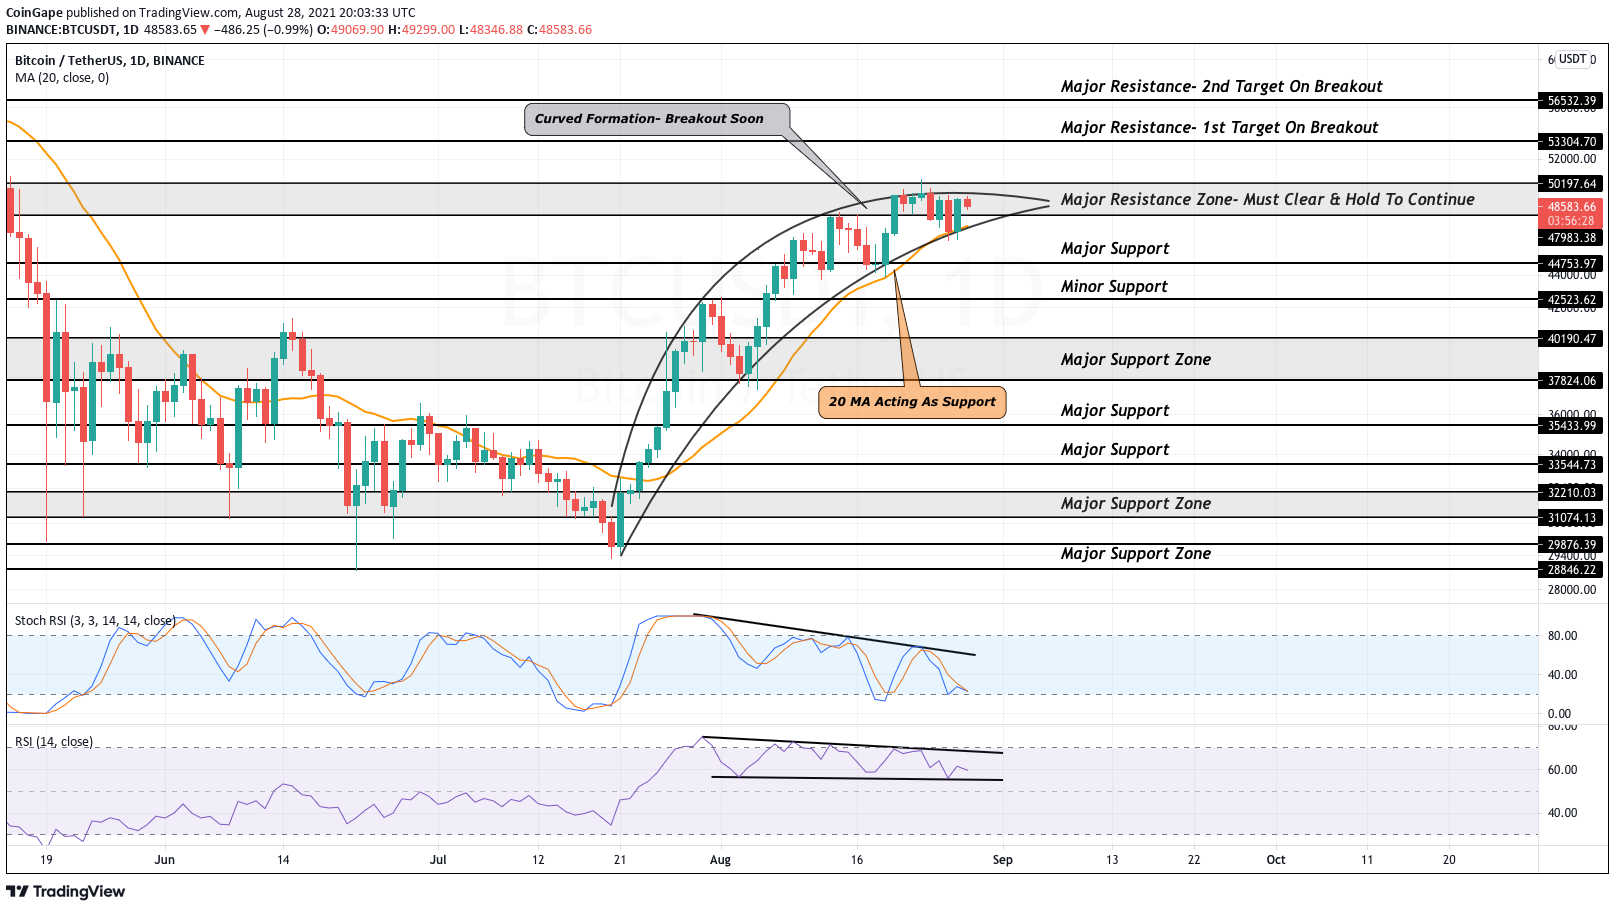
Throughout this bullish trend, BTC price has been held up by the 20 day MA. This MA has kept Bitcoin from starting a downtrend as bulls have fiercely bought each time price has reached it. We can use this MA as a good reference to whether BTC remains bullish or is entering a bearish state. If bulls fail to break the major resistance zone & break below the curved formation, we should expect BTC to break below this MA. If this occurs, BTC price will then be in a confirmed bear trend & we should expect prices to land between $42,000-$44,700.
- While looking at the Stochastic RSI, we can see how strength has continued to print lower highs despite price printing higher highs. This is considered a bearish divergence & would land BTC price back below $45,000 if it plays out. Strength must break over the trend line to negate this possibility.
- Looking at the RSI, we can see a channel formation has kept strength going sideways the past few weeks. Strength must break the top trend of this channel for BTC price to have a shot at reaching mid $50,000s.
BTC Intraday Analysis
- Spot rate: $48635
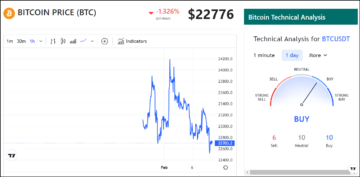
- Trend: Neutral
- Volatility: High
- Support: $46600
- Resistance: $50200
Subscribe to our newsletter for free

Source: https://coingape.com/bitcoin-stalls-at-major-resistance-zone-will-bulls-push-past-50000/
- &
- 000
- Action
- analysis
- bearish
- Bitcoin
- Bitcoin BTC
- Black
- breakout
- BTC
- btc price
- BTC/USDT
- Bullish
- Bulls
- Coingape
- Coins
- content
- cryptocurrencies
- curve
- day
- experience
- financial
- good
- hold
- How
- HTTPS
- investing
- Investors
- IT
- large
- Line
- major
- mark
- Market
- market research
- Newsletter
- Opinion
- Pattern
- price
- Price Analysis
- range
- research
- Share
- Signs
- State
- support
- surge
- time
- top
- week
- within