Bitcoin Price Prediction – June 23
There had once again been a sharp decline in the market valuation of BTC/USD in the last few days’ sessions. The crypto’s value rebounds at a critical support line to now trade around the level of $34,130 at a rate of 5.11 percent.
BTC/USD Market
Key Levels:
Resistance levels: $37,500, $42,500, $47,500
Support levels: $30,000, $27,500, $25,000

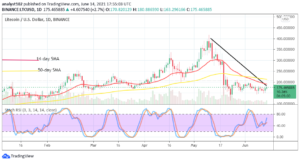
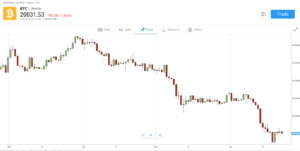
BTC/USD – Daily Chart
A critical support line is found at the level of $30,000 on the BTC/USD daily chart as it was formerly breached southward during yesterday’s session. But, towards the end, the market started to rebound from the downward move to an increased value above the point currently. The bearish trend-line has drawn to conjoin with the 14-day SMA trend-line underneath the 50-day SMA indicator. The Stochastic Oscillators have moved southbound to touch range 20. And, they are now seemingly attempting to close the lines to probably signal a pause in the falling forces.
The critical support line at $30,000, could it be a valid point to getting reliable upswing return?
For the second time in the BTC/USD trading history, the critical support-line at $30,000 has breached unsustainably to validate the level for getting decent upswing entry. Being as it is, a buying wall now again to have been set around the critical level and the immediate resistance point of $37,500. Meanwhile, the last higher point mentioned could be the area where price may experience a pit stop at a later time.
The downside may also re-launch around the immediate resistance level of the $37,500 or the $40,000 in an extension. But, it would be necessary that a line of candlesticks denoting a rejection signal trading situation be allowed to take a formation around those values coupled with an active upward trend reversal move before considering a probable decent sell-off time again.
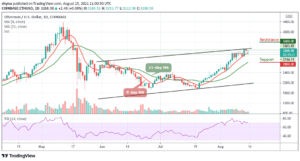
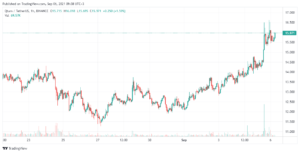
BTC/USD 4-hour Chart
On the BTC/USD 4-hour chart, the market’s rebounding movement from a critical support line has seemed to be trading around a visible resistance path that both the 14-day SMA and the bearish trend lines have conjoined underneath the 50-day SMA indicator. The Stochastic Oscillators have also moved northbound into the overbought region to probably signal a brief suspension in the current upward force. If the market is strongly resisted around the conjoined zone of the two indicators, then, price will have to decline once again to rebuild its support around the previous lower values.
Looking to buy or trade Bitcoin (BTC) now? Invest at eToro!
75% of retail investor accounts lose money when trading CFDs with this provide
Source: https://insidebitcoins.com/news/bitcoin-btc-usd-rebounds-at-critical-support-line