- Bitcoin cash price started a fresh decline from the $112 zone against the US Dollar.
- The price is now trading below the $105 zone and the 55 simple moving average (4-hours).
- There is a major bearish trend line forming with resistance near $103 on the 4-hours chart of the BCH/USD pair (data feed from Coinbase).
- The pair could continue to move down if it breaks the $98 and $95 support levels.
Bitcoin cash price is declining from the $112 zone against the US Dollar, similar to bitcoin. BCH/USD could decline heavily if there is a move below $95.
Bitcoin Cash Price Analysis
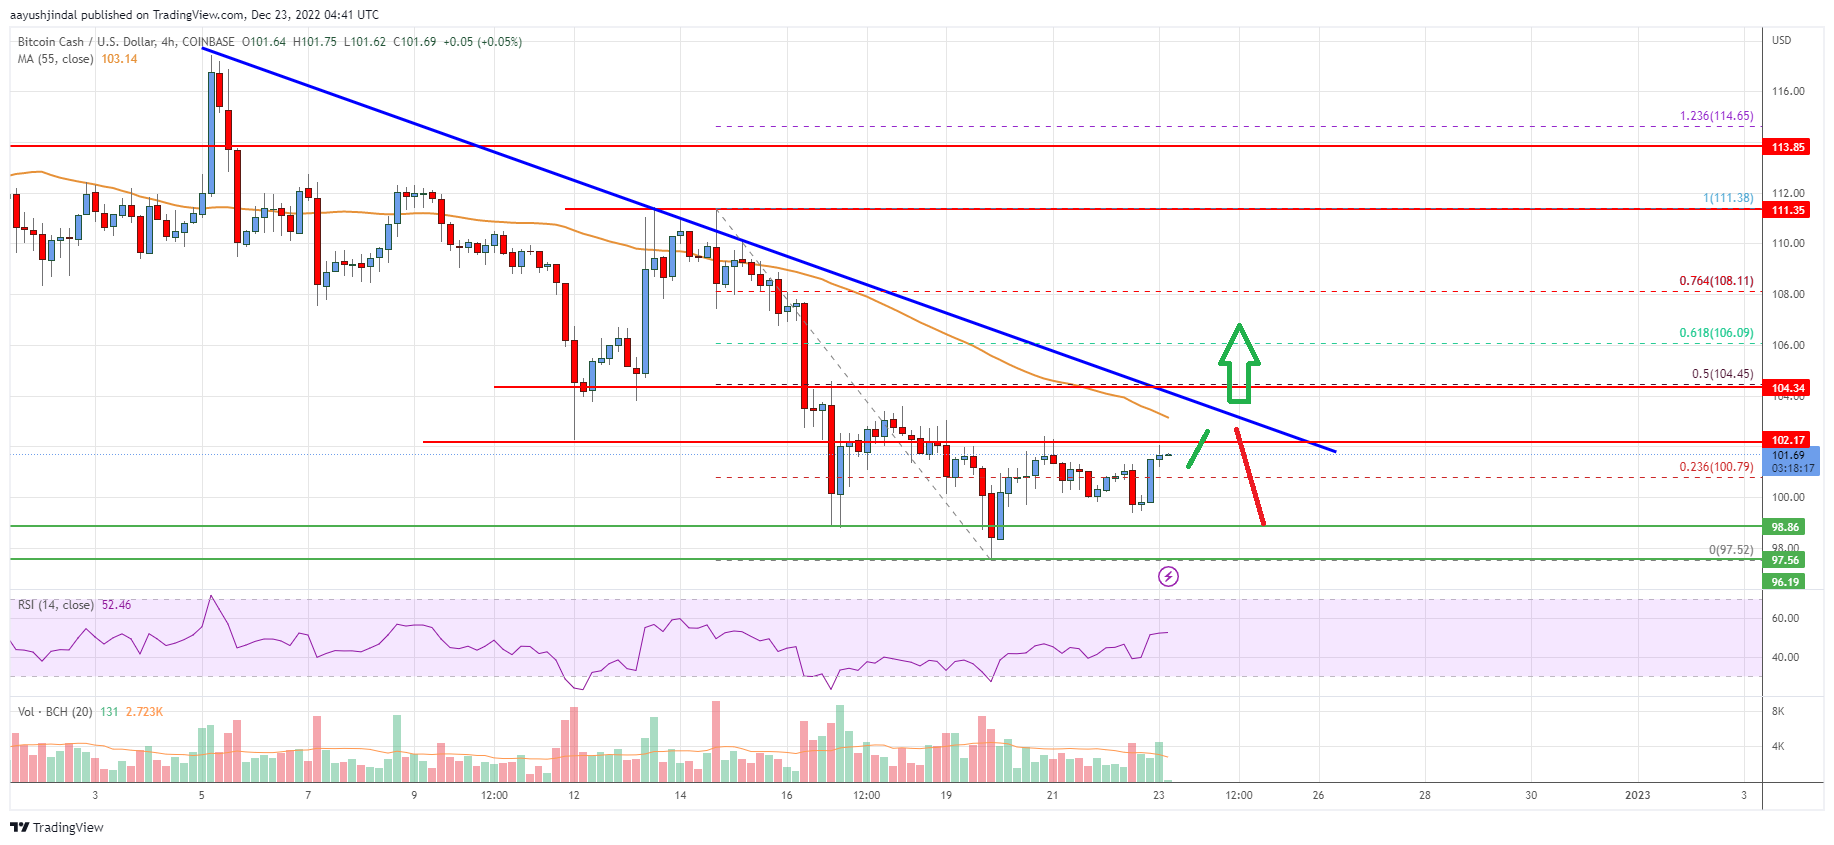
Bitcoin cash price struggled to gain pace for a move above the $111 and $112 resistance levels. BCH formed a high near $111.38 and started a fresh decline.
There was a clear move below the $110 and $105 support levels. The bears even pushed the price below the $100 support and the 55 simple moving average (4-hours). It traded as low as $97.52 before there was an upside correction.
The price climbed above the 23.6% Fib retracement level of the downward wave from the $111.38 swing high to $97.52 low. However, the price is struggling to rise above the $102 zone and the 55 simple moving average (4-hours).
There is also a major bearish trend line forming with resistance near $103 on the 4-hours chart of the BCH/USD pair. The trend line is near the 50% Fib retracement level of the downward wave from the $111.38 swing high to $97.52 low.
The main resistance sits near the $105 level. Any more gains above $103 and $105 could set the pace for a move towards the $112 level. If there is a move above the $112 resistance, the price could rise towards the $120 zone.
An immediate support on the downside is near the $98 zone. The next major support is near the $95 level, below which the bears might aim $88. The next target for them may perhaps be near the $80 level.
Bitcoin Cash Price
Looking at the chart, bitcoin cash price is now trading below the $105 zone and the 55 simple moving average (4-hours). Overall, the price could continue to move down if it breaks the $98 and $95 support levels.
Technical indicators
4 hours MACD – The MACD for BCH/USD is losing pace in the bearish zone.
4 hours RSI (Relative Strength Index) – The RSI for BCH/USD is above the 50 level.
Key Support Levels – $98 and $95.
Key Resistance Levels – $102 and $105.
- SEO Powered Content & PR Distribution. Get Amplified Today.
- Platoblockchain. Web3 Metaverse Intelligence. Knowledge Amplified. Access Here.
- Source: https://www.livebitcoinnews.com/bitcoin-cash-analysis-recovery-could-fade-near-102/
- a
- above
- against
- analysis
- and
- average
- BCH
- BCH/USD
- bearish
- Bears
- before
- below
- Bitcoin
- Bitcoin Cash
- breaks
- Cash
- Chart
- clear
- Climbed
- coinbase
- comments
- continue
- could
- data
- Decline
- Declining
- Dollar
- down
- downside
- downward
- Even
- fade
- follow
- formed
- fresh
- from
- Gain
- Gains
- heavily
- High
- HOURS
- However
- HTTPS
- immediate
- in
- index
- internal
- IT
- Level
- levels
- Line
- losing
- Low
- MACD
- Main
- major
- might
- more
- move
- moving
- moving average
- Near
- next
- overall
- Pace
- perhaps
- plato
- Plato Data Intelligence
- PlatoData
- Post
- price
- pushed
- recovery
- relative strength index
- Resistance
- retracement
- Rise
- rsi
- set
- similar
- Simple
- started
- strength
- Struggling
- support
- support levels
- TAG
- Target
- The
- to
- towards
- traded
- Trading
- TradingView
- Trend
- Upside
- us
- US Dollar
- Wave
- which
- zephyrnet