- Bitcoin cash price started a fresh decline from the $112 zone against the US Dollar.
- The price is now trading below the $112 zone and the 55 simple moving average (4-hours).
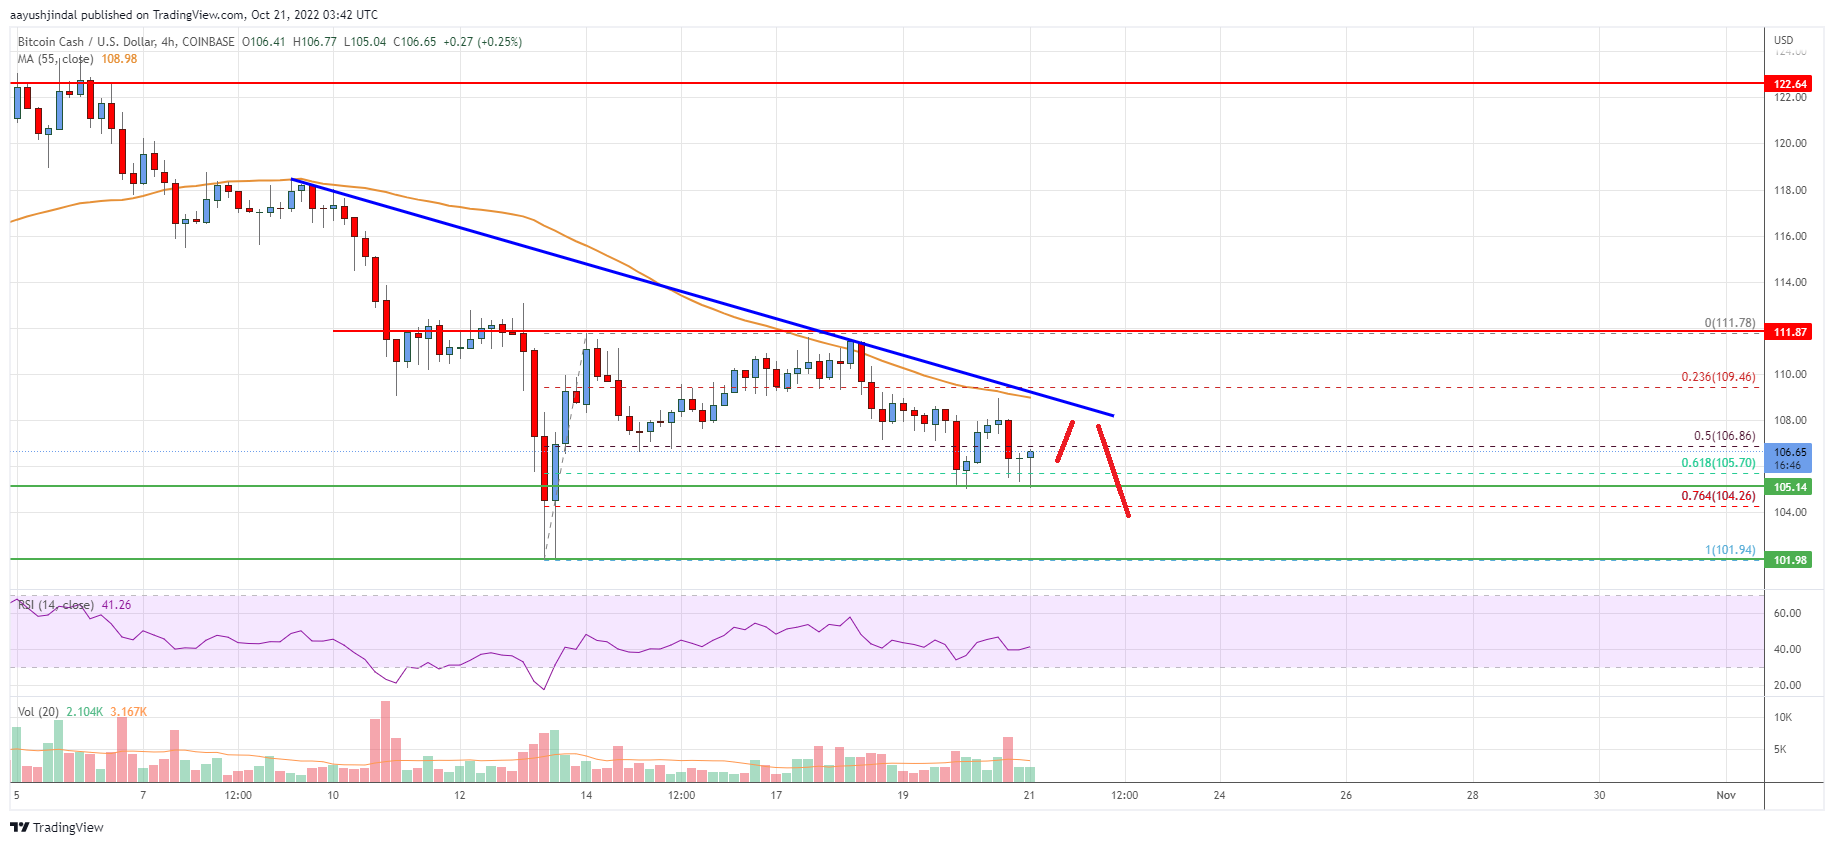
- There is a major bearish trend line forming with resistance near $108 on the 4-hours chart of the BCH/USD pair (data feed from Coinbase).
- The pair could start a recovery wave if there is a clear move above the $110 and $112 levels.
Bitcoin cash price is declining from the $112 zone against the US Dollar, similar to bitcoin. BCH/USD could decline heavily if there is a move below $105.
Bitcoin Cash Price Analysis
Bitcoin cash price struggled to gain pace for a move above the $112 and $115 resistance levels. BCH formed a high near $112 and started a fresh decline.
There was a clear move below the $110 and $108 support levels. There was a clear move below the 50% Fib retracement level of the upward move from the $102 swing low to $112 high. The price is now trading below the $112 zone and the 55 simple moving average (4-hours).
An immediate support on the downside is near the $105 zone. It is near the 61.8% Fib retracement level of the upward move from the $102 swing low to $112 high. The next major support is near the $102 level, below which the bears might aim $100.
The next target for them may perhaps be near the $95 level. On the upside, an immediate resistance is near the $108 level. There is also a major bearish trend line forming with resistance near $108 on the 4-hours chart of the BCH/USD pair.
The first major resistance is near the $112 level. The main resistance sits near the $115 level. Any more gains above $112 and $115 could set the pace for a move towards the $125 level. If there is a move above the $125 resistance, the price could rise towards the $140 zone.
Looking at the chart, bitcoin cash price is now trading below the $112 zone and the 55 simple moving average (4-hours). Overall, the price could start a recovery wave if there is a clear move above the $110 and $112 levels.
Technical indicators
4 hours MACD – The MACD for BCH/USD is losing pace in the bearish zone.
4 hours RSI (Relative Strength Index) – The RSI for BCH/USD is below the 50 level.
Key Support Levels – $105 and $102.
Key Resistance Levels – $108 and $112.
- Altcoin News
- BCH
- Bitcoin
- Bitcoin Cash
- blockchain
- blockchain compliance
- blockchain conference
- coinbase
- coingenius
- Consensus
- crypto conference
- crypto mining
- cryptocurrency
- decentralized
- DeFi
- Digital Assets
- ethereum
- Live Bitcoin News
- machine learning
- news
- non fungible token
- plato
- plato ai
- Plato Data Intelligence
- Platoblockchain
- PlatoData
- platogaming
- Polygon
- proof of stake
- Trading
- W3
- zephyrnet