The cryptocurrency market continues to experience some euphoric price moves from altcoins as Bitcoin remains the primary determinant and dictator of the market in recent weeks as price broke above key resistance of $32,000 to a high of $35,800 as many analysts, traders, and investors believe this could be the spark of a bull run.
The impending Bitcoin halving coming up in April of 2024 continues to be a talking point for many traders, investors, and analysts as there have been indications of the fundamentals and technical analysis of Bitcoin’s price action pointing to the big day that will usher in a time of bullish price action.
Speculations that Bitcoin spot ETF (Exchange-traded Fund) would be approved by December of 2023 or a few weeks before Bitcoin halving could spark more rally for this cryptocurrency asset as the highest market capitalization.
The cryptocurrency market hasn’t experienced such a green heat map for a while since the bear market began, as there have been more indications from the market and altcoin performance of the market experiencing a huge change in market sentiment.
– Advertisement –
This change in sentiment has led to the Bitcoin fear and greed indicator hitting over the 70% mark of green as the indicator suggests a minor pullback for prices including Bitcoin, Ethereum, and other weekly top 5 cryptos (XRP, SOL, BNB, ADA, MATIC).
A minor pullback for the cryptocurrency market is a healthy one as this would give room for higher price movement and weekly top 5 cryptos (XRP, SOL, BNB, ADA, MATIC) to perform better as some of these tokens continue to lag.
Although a minor pullback is possible, there has been high speculation of Bitcoin rallying higher than its present value as on-chain data continues to see a surge of activities on the Bitcoin network, suggesting bulls are dominating the market.
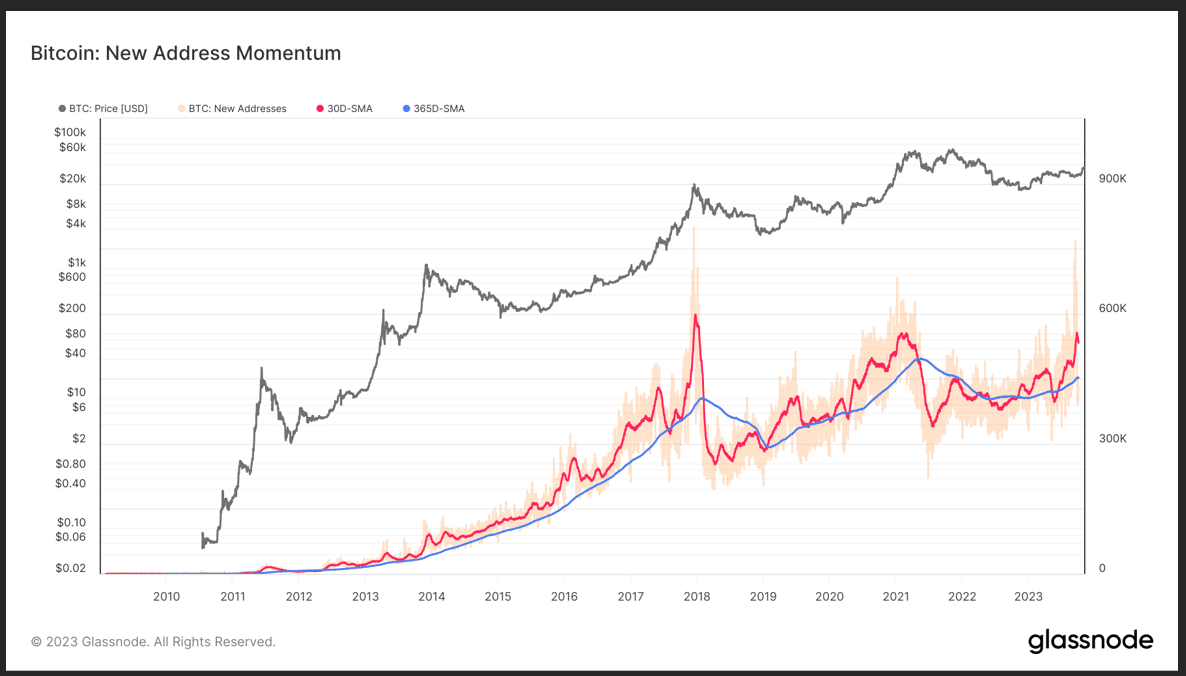
Bitcoin’s (BTC) price action has experienced much on-chain activities in recent weeks after its price broke above key resistance and its yearly high of $32,000, creating a new yearly high of $35,800 as price gears up for more bullish price movement in the coming months.
With on-chain activities on the rise, the price of Bitcoin in recent weeks has rallied from a region of $26,600 to a high of $35,800 as the price of Bitcoin faces key resistance to break past $36,000.
A break and close above the region of $36,000 would mean well for the market as the price could rally higher to $40,000 to $48,000, where its price would be faced with much resistance as this area remains a supply area for higher timeframes.
With the Bitcoin fear and greed index still pointing at market greed of 68 points, it remains an interest if the price would rally high to a region of $40,000 to $48,000, considering how bullish the crypto market remains now.
After having the highest monthly close above the region of $34,400, the price of Bitcoin has continued to trade above its 50-day, 100-day, and 200-day Exponential Moving Averages (50-day, 100-day, and 200-day EMAs) for the first time after a long bearish price run as indicators including the Moving Average Convergence Divergence (MACD) all point to a bullish price action.
Despite Bitcoin’s impressive price action, Ethereum’s (ETH) price rally remains a huge concern for many traders and investors as the price of Ethereum has continued to remain underperforming for the past few weeks in the shadows of Bitcoin as price struggles to trade above $1,850.
The price of Ethereum has faced much price worry as the second largest cryptocurrency by market capitalization remains underperforming as its price struggles to clear $1,900 as this region remains key for higher price action.
If the price of Ethereum fails to close above $1,900, which could open the way for a price rally to $2,000, we could see Ethereum retrace back to its support of $1,780 holding price from going lower.
A higher price rally for Ethereum could mean well for altcoins and weekly top 5 cryptos (XRP, SOL, BNB, ADA, MATIC) performing better than expected, as the new week promises to be exciting for traders and investors looking to trade these tokens.
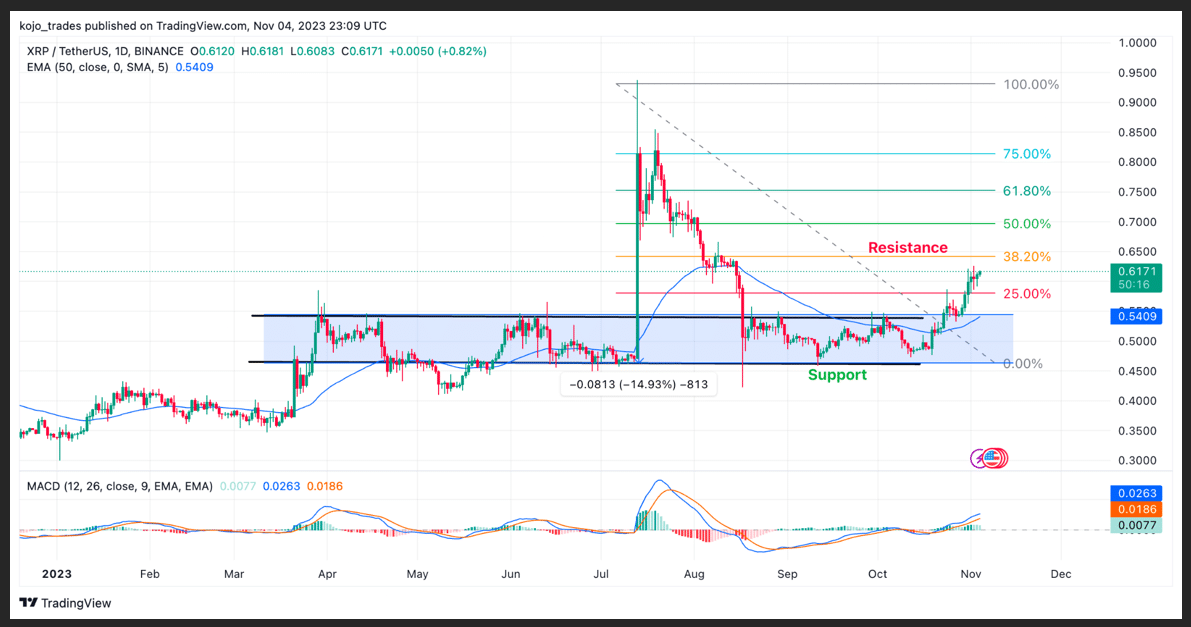
Ripple (XRP) Daily Price Chart as a Weekly Top 5 Cryptos to Watch
Ripple (XRP) has remained highly underperforming as it faced many struggles for dominance with the United States Security Exchange Commission (US SEC). It is believed its case with the US SEC has hampered its price growth fundamentally and technically.
Despite its struggles to be approved as a legal security for many traders and investors, Ripple’s on-chain data shows its dominance in the cryptocurrency market as it shows XRP/USDT maintains one of the highest activities. However, its price has struggled to replicate such trading activities.
After trading for weeks in a range of $0.47 to $0.55, the price of XRP/USDT currently trades above $0.6 as the price faces key resistance, which will be a determinant for the price of XRP/USDT trading higher than its current price.
The resistance of $0.65 for XRP/USDT corresponds to its 38.2% Fibonacci Retracement value (38.2% FIB Value) as the price of XRP/USDT needs to close above this point for its price to rally higher to a region of $0.9.
Ripple’s price action remains one of the most bullish charts in the cryptocurrency market on both higher and lower timeframes as its Relative Strength Index (RSI) and Moving Average Convergence Divergence (MACD) on the daily timeframe points to bullish momentum for XRP/USDT.
With many bullish sentiments and data pointing towards the growth of XRP/USDT, we could see one of the best performers in the coming bullish price rally for XRP/USDT, as the price could outperform many top crypto assets in the market.
Major XRP/USDT support zone – $0.55
Major XRP/USDT resistance zone – $0.65
MACD trend – Bullish
Solana (SOL) Price Chart Analysis on the Daily Timeframe
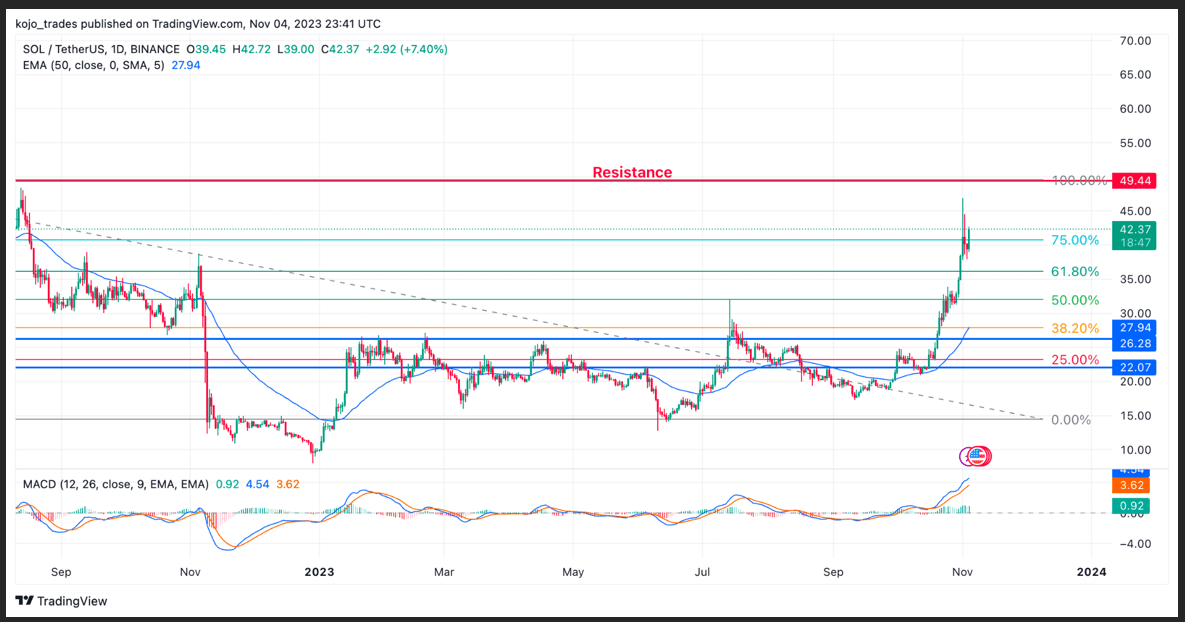
The price of Solana (SOL) was one of the best-performing cryptocurrency assets in the past weeks as the price rallied from a region of $14.5 to a high of $48 within a few weeks as there has been speculation of price rally higher as the next bull market approaches.
Solana has remained one of the top assets in the cryptocurrency market that has attracted investors and traders across the globe but suffered a hard deal during the crypto bear market as the price dropped from over $220 to a region of $10 associated with the collapse of FTX.
FTX were heavy investors of Solana as this great token possessed much potential and enabled scalability in the blockchain ecosystem but suffered many losses during the FTX fiasco, leading to a prolonged bearish price run for SOL/USDT.
Despite the US bankruptcy court granting permission to liquidate FTX assets, the price of SOL/USDT has demonstrated an incredible price action after closing above $32, which was its former yearly high as the price rallied to a high of $48 before suffering price decline as this region remains a supply zone for traders and investors.
The price of SOL/USDT currently trades above its 50-day EMA and 75% of its FIB value, highlighting much bullish price action for its price as the price of SOL/USDT could be looking to break above $50 to continue its price rally to $80 and possibly $100.
The region of $36.5, which corresponds to 61.8% FIB value, remains as key support for SOL/USDT as its MACD and RSI indicators point to more bullish price action for SOL/USDT.
Major SOL/USDT support zone – $36.5
Major SOL/USDT resistance zone – $50
MACD trend – Bullish
Binance Coin Price Analysis as a Top Cryptocurrency Asset
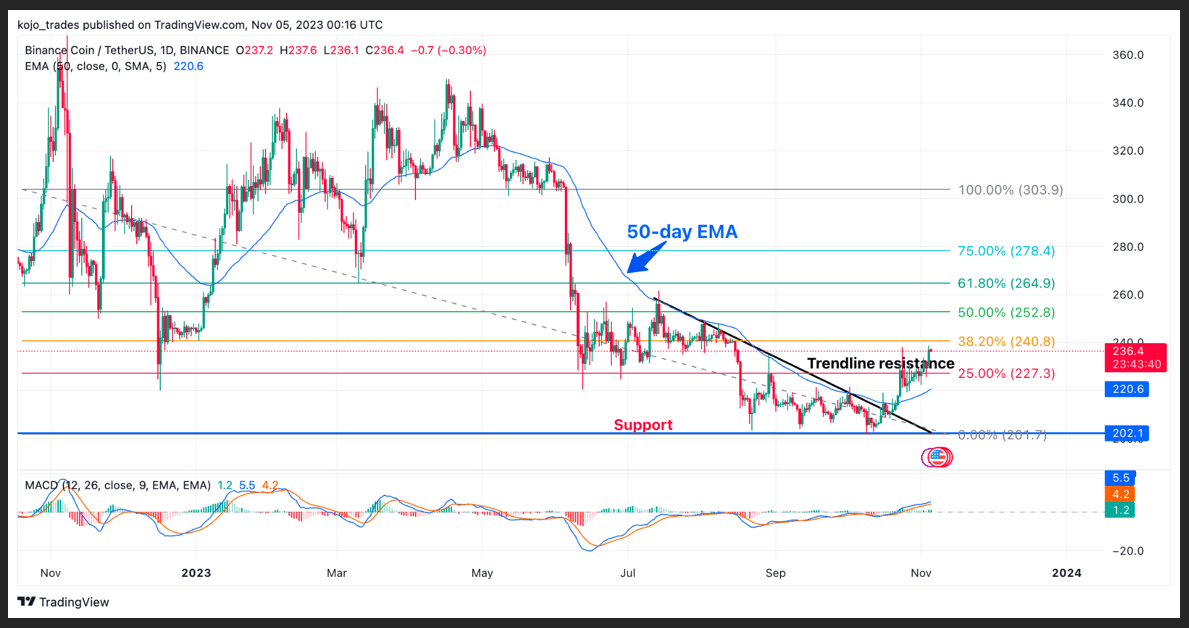
Binance Coin (BNB) has received its fair share of price loss in the bear market as the price of BNB/USDT dropped from its all-time high of $660 to a low of $200 as the price bounced from this area of demand to hold strong against a bearish sell-off.
Despite much FUD (fear, uncertainty, and doubt) surrounding BNB/USDT price, the price of BNB/USDT has found several ways of defending this region of $200 as bears would be looking at capitalizing at this region to push the price lower.
The price of BNB/USDT has remained dormant in recent weeks as many cryptocurrency altcoins rally with much price action. After forming a downtrend line, the price of BNB/USDT broke out of this downtrend, with the price currently facing resistance around $240.
The price of BNB/USDT must break above $240 convincingly to rally higher to a resistance of $275, corresponding to the 50% FIB value. If the price of BNB/USDT breaks and holds above $240, we could see a price rally to the next resistance.
The price of BNB/USDT is currently trading above the 50-day EMA as the price shows a change in trend from a bearish to a bullish trend in the past weeks, with its MACD and RSI all indicating a bullish price trend for BNB.
Major BNB/USDT support zone – $220
Major BNB/USDT resistance zone – $275
MACD trend – Bullish
Cardano (ADA) Price Chart Analysis on the Daily Timeframe

Cardano (ADA) remains one of the top cryptocurrencies in the market with a strong community, huge investors and traders backing this great project as many traders and investors believe it could be the next Ethereum killer.
The price action for Cardano (ADA) in recent times has been encouraging as there has been rumor of ADA holders being eligible for its Midnight Airdrop as holders and traders ask questions about becoming eligible as holders.
The price of ADA/USDT suffered a much price decline to a region of $0.24 as the price formed a strong support to hold-off sellers or bears from dominating price lower to its yearly low of $0.18 as the price bounced quickly to trade above its 50-day EMA.
After forming what looked like a double bottom on the daily timeframe, the price of ADA/USDT bounced from $0.24 to show strength, rallying to a high of $0.32 above its key support, corresponding to 38.2% of its FIB value.
With much bullish action as indicated by its MACD and RSI, the price of ADA/USDT is aiming to recapture the highs of $0.4 to a high of $0.45 as the bulls continue to show strength and much price dominance in the.
Major ADA/USDT support zone – $0.3
Major ADA/USDT resistance zone – $0.4-$0.45
MACD trend – Bullish
Polygon (MATIC) Price Analysis as a Weekly Top 5 Cryptos to Watch
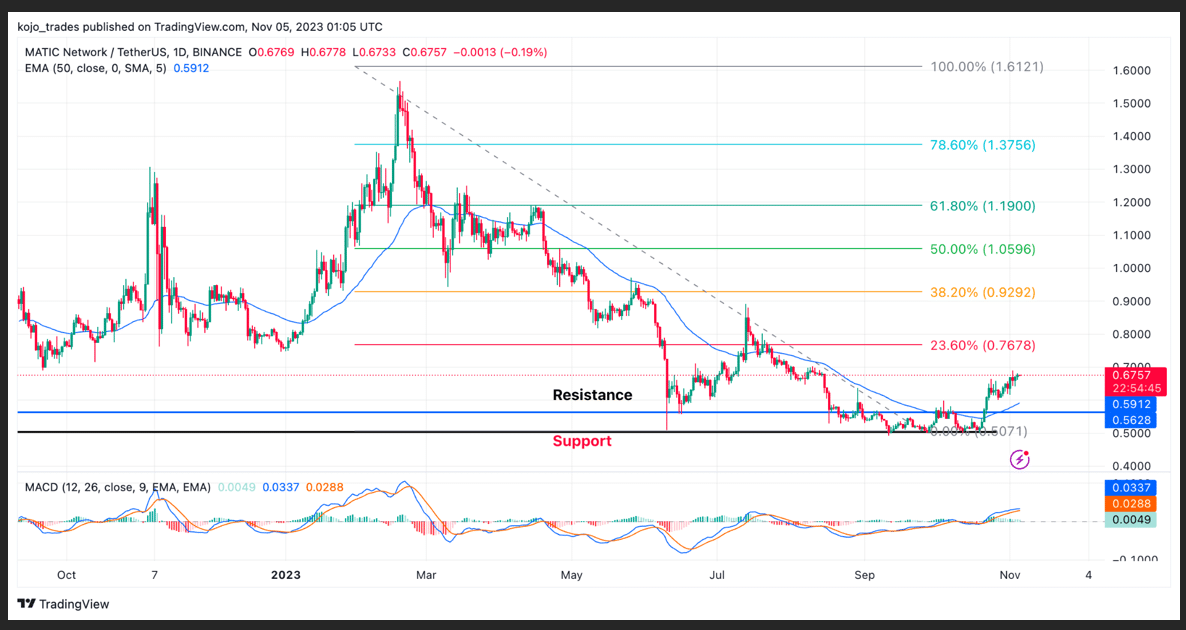
The current market rally has been good for Polygon (MATIC), which has remained inactive in its price movement as the price ranges around $0.5 to $0.56 for weeks as it has formed what looks like the bottom around $0.5.
Despite much euphoria of the cryptocurrency market returning to its busy times in recent weeks, the price of MATIC/USDT has shown little price action as this needs more volume to push the price of MATIC/USDT higher.
The price of MATIC/USDT could face its first strong resistance of $0.75, which corresponds to the 23.6% FIB value, as a break and close above this region could signal happy times ahead for many MATIC holders.
The price of MATIC/USDT currently trades above its 50-day EMA, corresponding to support of $0.6, as the price faces many tasks to reclaim higher regions for much bullish price action.
If the price of MATIC/USDT breaks above $1.1, it could mean bullish price action for bulls to push the price to a region of $1.5 and possibly $2.
MATIC’s MACD and RSI indicators show the price gradually building bullishness as the current price is accompanied by less volume to enable bulls to rally the price of MATIC/USDT higher.
Major MATIC/USDT support zone – $0.6
Major MATIC/USDT resistance zone – $0.75
MACD trend – Bullish
Follow Us on Twitter and Facebook.
Disclaimer: This content is informational and should not be considered financial advice. The views expressed in this article may include the author’s personal opinions and do not reflect The Crypto Basic’s opinion. Readers are encouraged to do thorough research before making any investment decisions. The Crypto Basic is not responsible for any financial losses.
-Advertisement-
- SEO Powered Content & PR Distribution. Get Amplified Today.
- PlatoData.Network Vertical Generative Ai. Empower Yourself. Access Here.
- PlatoAiStream. Web3 Intelligence. Knowledge Amplified. Access Here.
- PlatoESG. Carbon, CleanTech, Energy, Environment, Solar, Waste Management. Access Here.
- PlatoHealth. Biotech and Clinical Trials Intelligence. Access Here.
- Source: https://thecryptobasic.com/2023/11/05/bitcoin-halving-nears-weekly-top-5-cryptos-to-watch-xrp-sol-bnb-ada-matic/?utm_source=rss&utm_medium=rss&utm_campaign=bitcoin-halving-nears-weekly-top-5-cryptos-to-watch-xrp-sol-bnb-ada-matic
- :has
- :is
- :not
- :where
- $UP
- 000
- 1
- 11
- 2%
- 2023
- 2024
- 23
- 24
- 32
- 400
- 65
- 75
- 9
- a
- About
- above
- accompanied
- across
- Action
- activities
- ADA
- Advertisement
- advice
- After
- against
- ahead
- Aiming
- airdrop
- All
- Altcoin
- Altcoins
- an
- analysis
- Analysts
- and
- any
- approaches
- approved
- April
- ARE
- AREA
- around
- article
- AS
- ask
- asset
- Assets
- associated
- At
- attracted
- author
- average
- back
- backing
- Bankruptcy
- Bankruptcy Court
- basic
- BE
- Bear
- Bear Market
- bearish
- Bears
- becoming
- been
- before
- began
- being
- believe
- believed
- BEST
- Better
- Big
- Bitcoin
- Bitcoin fear and greed
- Bitcoin halving
- Bitcoin Network
- Bitcoin spot etf
- blockchain
- blockchain ecosystem
- bnb
- BNB/USDT
- both
- Bottom
- Break
- breaks
- Broke
- BTC
- Building
- bull
- Bull Market
- Bull Run
- Bullish
- Bulls
- busy
- but
- by
- capitalization
- capitalizing
- Cardano
- Cardano (ADA)
- case
- chain
- Chain Analysis
- change
- Chart
- Charts
- clear
- Close
- closing
- Coin
- Collapse
- coming
- commission
- community
- Concern
- considered
- considering
- content
- continue
- continued
- continues
- Convergence
- Corresponding
- corresponds
- could
- Court
- Creating
- crypto
- Crypto bear market
- Crypto Market
- crypto-assets
- cryptocurrencies
- cryptocurrency
- Cryptocurrency Assets
- cryptocurrency market
- cryptos
- Current
- Currently
- daily
- data
- day
- deal
- December
- decisions
- Decline
- Defending
- Demand
- demonstrated
- Divergence
- do
- Dominance
- dominating
- double
- double bottom
- doubt
- dropped
- during
- ecosystem
- eligible
- EMA
- enable
- enabled
- encouraged
- encouraging
- ETF
- ETH
- Ether (ETH)
- ethereum
- Ethereum's
- exchange
- Exchange Commission
- exchange-traded
- exciting
- expected
- experience
- experienced
- experiencing
- exponential
- expressed
- Face
- faced
- faces
- facing
- fails
- fair
- fear
- fear and greed index
- few
- Fibonacci
- financial
- financial advice
- First
- first time
- For
- formed
- Former
- found
- from
- FTX
- FUD
- fund
- fundamentally
- Fundamentals
- gears
- gears up
- Give
- globe
- going
- good
- gradually
- granting
- great
- Greed
- Green
- Growth
- Halving
- happy
- Hard
- Have
- having
- healthy
- heavy
- High
- higher
- highest
- highlighting
- highly
- Highs
- hitting
- hold
- holders
- holding
- holds
- How
- However
- http
- HTTPS
- huge
- ID
- if
- impending
- impressive
- in
- inactive
- include
- Including
- incredible
- index
- indicated
- indicating
- indications
- Indicator
- Indicators
- Informational
- interest
- investment
- Investors
- IT
- ITS
- Key
- key resistance
- killer
- largest
- leading
- Led
- Legal
- less
- like
- Line
- liquidate
- little
- Long
- looked
- looking
- LOOKS
- loss
- losses
- Low
- lower
- MACD
- maintains
- Making
- many
- map
- mark
- Market
- Market Capitalization
- market sentiment
- Matic
- max-width
- May..
- mean
- midnight
- minor
- Momentum
- monthly
- months
- more
- most
- movement
- moves
- moving
- moving average
- moving averages
- much
- must
- needs
- network
- New
- next
- now
- of
- on
- On-Chain
- on-chain data
- ONE
- open
- Opinion
- Opinions
- or
- Other
- out
- Outperform
- over
- past
- perform
- performance
- performers
- performing
- permission
- personal
- plato
- Plato Data Intelligence
- PlatoData
- Point
- points
- Polygon
- Polygon (MATIC)
- possible
- possibly
- potential
- present
- price
- PRICE ACTION
- Price Analysis
- price chart
- price rally
- Prices
- primary
- project
- promises
- pullback
- Push
- Questions
- quickly
- rally
- range
- readers
- received
- recent
- reflect
- region
- regions
- relative
- relative strength index
- Relative Strength Index (RSI)
- remain
- remained
- remains
- research
- Resistance
- responsible
- retracement
- returning
- Rise
- Room
- rsi
- Run
- s
- Scalability
- SEC
- Second
- security
- Security Exchange Commission
- see
- sell-off
- Sellers
- sentiment
- sentiments
- several
- Share
- should
- show
- shown
- Shows
- Signal
- since
- SOL
- Solana
- Solana (SOL)
- some
- Spark
- speculation
- Spot
- spot etf
- States
- Still
- strength
- strong
- Struggles
- such
- suffered
- suffering
- Suggests
- supply
- support
- surge
- Surrounding
- TAG
- talking
- tasks
- Technical
- Technical Analysis
- technically
- than
- that
- The
- The Crypto Basic
- There.
- These
- this
- time
- timeframe
- times
- to
- token
- Tokens
- top
- top 5
- towards
- trade
- Traders
- trades
- Trading
- Trend
- Uncertainty
- United
- United States
- us
- US BANKRUPTCY
- US Sec
- USDT
- value
- views
- volume
- W3
- was
- Watch
- Way..
- ways
- we
- webp
- week
- weekly
- Weeks
- WELL
- were
- What
- which
- while
- will
- with
- within
- worry
- would
- would give
- xrp
- XRP/USDT
- yearly
- zephyrnet