Bitcoin, the world’s most valuable coin, is once again deviating from historical norms. According to an analysis by one crypto analyst, the coin is in the “overbought” territory of the Relative Strength Index (RSI) for the first time in the lead-up to halving. The RSI is a popular technical indicator analysts use to gauge the price momentum of traded instruments.
Bitcoin Overheating? RSI Stands Above 70
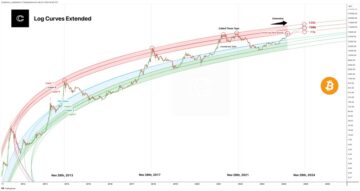
The analyst points out that the Bitcoin RSI on the monthly chart is currently above 70, indicating an overbought condition and overheating. This is a significant development as it’s the first time in Bitcoin’s history that this has happened before a halving.
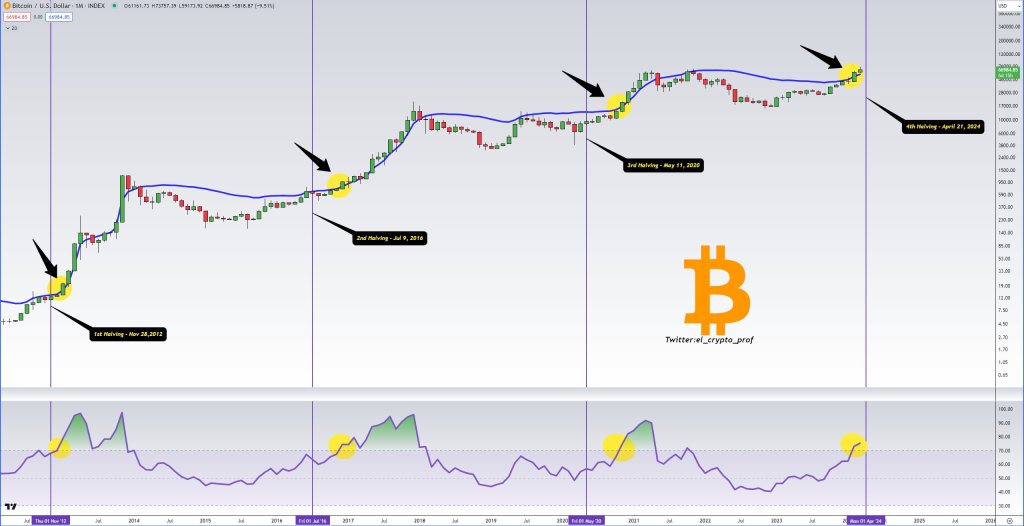
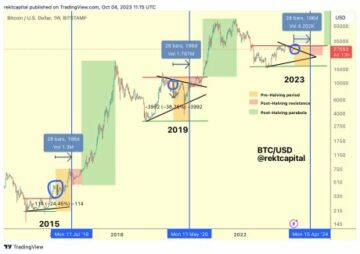
The Bitcoin network is set to halve miner rewards in mid-April. This event, which occurs roughly every 200,000 blocks, will cut rewards distributed to miners by 50% from the current level of 6.125 BTC. Miners play a vital role in confirming transactions and maintaining network security.
The fact that Bitcoin prices appear to be “overheating” just before halving is net bullish for the coin. It suggests that prices are not only breaking from historical trends but also building strong momentum.
Besides the strong upside momentum, the analyst notes that Bitcoin now trades above a critical dynamic level on the monthly chart.
The confluence of these positive developments could explain why traders are upbeat. Most analysts agree that the coin will likely break higher in the weeks ahead, clearing the recent all-time high of around $73,800.
BTC Pinned Below $73,000 And Consolidating
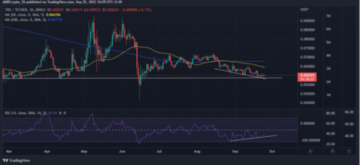
Thus far, Bitcoin prices are firm, increasing as evident in the daily chart. After sharp contractions in the past few trading sessions, the welcomed reversal over the weekend lifted the coin towards the elusive $70,000 level and a previous all-time high.
However, judging from the candlestick arrangement in the daily chart, a break above $73,800 would likely catalyze more demand. So far, prices are moving sideways within a broad range despite signals of strength relayed from other indicators.
While some investors are bullish, expecting prices to rise, caution should prevail. A close above $74,000 would thrust Bitcoin into unchartered territory. Beyond this, the analyst uses technical indicators to make projections. These tools use historical parameters and lag. As such, they may not be as accurate and, thus, misleading in some instances.
Feature image from DALLE, chart from TradingView
Disclaimer: The article is provided for educational purposes only. It does not represent the opinions of NewsBTC on whether to buy, sell or hold any investments and naturally investing carries risks. You are advised to conduct your own research before making any investment decisions. Use information provided on this website entirely at your own risk.
- SEO Powered Content & PR Distribution. Get Amplified Today.
- PlatoData.Network Vertical Generative Ai. Empower Yourself. Access Here.
- PlatoAiStream. Web3 Intelligence. Knowledge Amplified. Access Here.
- PlatoESG. Carbon, CleanTech, Energy, Environment, Solar, Waste Management. Access Here.
- PlatoHealth. Biotech and Clinical Trials Intelligence. Access Here.
- Source: https://www.newsbtc.com/bitcoin-news/bitcoin-overheating-first-time-ever-before-halving/
- :has
- :is
- :not
- 000
- 1
- 125
- 200
- 6
- 70
- 800
- a
- above
- According
- accurate
- advised
- After
- again
- agree
- ahead
- also
- an
- analyst
- Analysts
- and
- any
- appear
- ARE
- around
- arrangement
- article
- AS
- At
- BE
- before
- below
- Beyond
- binance
- Bitcoin
- Bitcoin Network
- Bitcoin Price
- Bitcoin prices
- Blocks
- Break
- Breaking
- broad
- BTC
- BTCUSDT
- Building
- Bullish
- but
- buy
- by
- catalyze
- caution
- Chart
- Clearing
- Close
- Coin
- condition
- Conduct
- confirming
- confluence
- could
- critical
- crypto
- crypto analyst
- Current
- Currently
- daily
- decisions
- Demand
- Despite
- Development
- developments
- distributed
- does
- dynamic
- educational
- entirely
- Event
- EVER
- Every
- evident
- expecting
- Explain
- fact
- far
- few
- Firm
- First
- first time
- For
- from
- gauge
- Halving
- happened
- High
- higher
- historical
- history
- hold
- HTTPS
- image
- in
- increasing
- index
- indicating
- Indicator
- Indicators
- information
- instances
- instruments
- into
- investing
- investment
- Investments
- Investors
- IT
- jpg
- just
- Level
- Lifted
- likely
- maintaining
- make
- Making
- max-width
- May..
- miner
- Miners
- misleading
- Momentum
- monthly
- more
- most
- moving
- naturally
- net
- network
- Network Security
- NewsBTC
- norms
- Notes
- now
- of
- on
- once
- ONE
- only
- Opinions
- or
- Other
- out
- over
- own
- parameters
- past
- plato
- Plato Data Intelligence
- PlatoData
- Play
- points
- Popular
- positive
- previous
- price
- Prices
- projections
- provided
- purposes
- range
- recent
- relative
- relative strength index
- Relative Strength Index (RSI)
- represent
- research
- Reversal
- Rewards
- Rise
- Risk
- risks
- Role
- roughly
- rsi
- security
- sell
- sessions
- set
- sharp
- should
- sideways
- signals
- significant
- So
- so Far
- some
- Source
- stands
- strength
- strong
- such
- Suggests
- Technical
- territory
- that
- The
- These
- they
- this
- thrust
- Thus
- time
- to
- tools
- towards
- traded
- Traders
- trades
- Trading
- Trading sessions
- TradingView
- Transactions
- trending
- Trends
- true
- upbeat
- Upside
- upward
- use
- uses
- Valuable
- vital
- Website
- weekend
- Weeks
- welcomed
- whether
- which
- why
- will
- within
- world’s
- would
- X
- you
- Your
- zephyrnet