- Bitcoin price started a fresh increase after testing the $47,500 support against the US Dollar.
- The price is now trading above $52,000, but it is struggling near the 55 simple moving average (4-hours).
- There was a break below a major rising channel with support near $55,800 on the 4-hours chart of the BTC/USD pair (data feed from Coinbase).
- The pair is likely to start a fresh decline if it fails to clear the $56,000 resistance zone in the near term.
Bitcoin price is attempting an upside correction above $52,000 against the US Dollar. BTC must surpass $56,000 and $56,450 to move into a positive zone.
Bitcoin Price Analysis
After a steady decline, bitcoin price found support near the $47,500 zone against the US Dollar. BTC formed a support base and it started a fresh increase above the $52,000 resistance zone.
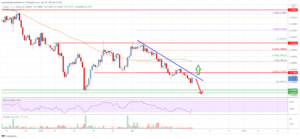
There was also a break above the $55,000 resistance level and the 55 simple moving average (4-hours). However, the price struggled near the $59,000 zone. A high was formed near $59,042 before the price started a fresh decline.
There was a break below the $56,000 support zone and the 55 simple moving average (4-hours). There was also a break below a major rising channel with support near $55,800 on the 4-hours chart of the BTC/USD pair.
The pair traded as low as $52,972 and it is now correcting losses. It climbed above the 23.6% Fib retracement level of the recent decline from the $59,042 swing high to $52,972 low. It is now facing a major resistance near the previous support at $56,000 and the 55 simple moving average (4-hours).
The 50% Fib retracement level of the recent decline from the $59,042 swing high to $52,972 low is also near the $56,000 zone. If there is an upside break above the $56,000 resistance zone, the price is likely to accelerate higher in the near term.
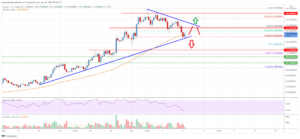
The next major hurdle is near the $59,000 level, above which the price is likely to climb higher towards the $60,000 and $62,000 levels. On the downside, the $54,000 level is a decent support. The main breakdown support is near the $51,250 level, below which there could be a sharp decline towards $47,000.

Bitcoin Price
Looking at the chart, bitcoin price is clearly trading above $52,000, but it is struggling near the 55 simple moving average (4-hours). Overall, the price is likely to start a fresh decline if it fails to clear the $56,000 resistance zone.
Technical indicators
4 hours MACD – The MACD is slowly gaining momentum in the bullish zone.
4 hours RSI (Relative Strength Index) – The RSI is well below the 50 level.
Key Support Levels – $54,000 and $51,250.
Key Resistance Levels – $56,000, $59,000 and $60,000.
Source: https://www.livebitcoinnews.com/bitcoin-price-analysis-btc-faces-major-hurdle-dips-limited/