- Bitcoin price started a fresh increase above the $24,000 zone against the US Dollar.
- The price is now trading above $23,000 and the 55 simple moving average (4-hours).
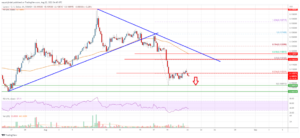
- There was a break above a crucial bearish trend line with resistance near $21,950 on the 4-hours chart of the BTC/USD pair (data feed from Coinbase).
- The pair could continue to rise if there is a clear move above $25,250 level.
Bitcoin price is showing positive signs above $24,000 against the US Dollar. BTC might gain bullish momentum if there is a clear move above the $25,250 zone.
Bitcoin Price Analysis
Bitcoin price started a steady increase from the $20,000 support zone. The price gained and cleared many hurdles near the $22,500 and $23,500 levels.
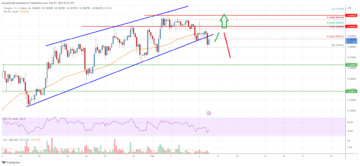
There was a clear move above the $24,000 level and the 55 simple moving average (4-hours). Besides, there was a break above a crucial bearish trend line with resistance near $21,950 on the 4-hours chart of the BTC/USD pair. The bulls gained pace for a move above the $25,000 zone.
The price even spiked above the $26,000 resistance zone and formed a high near $26,533. Recently, there was a downside correction below the $25,500 level.
The price declined below the 23.6% Fib retracement level of the upward move from the $19,568 swing low to $26,533 high. The price is now trading above $23,000 and the 55 simple moving average (4-hours). An immediate resistance on the upside is near the $25,250 level.
The first major resistance is near the $26,000 level. The next major resistance on the upside is near the $26,500 level, above which the price could rise towards the $27,800 zone.
Any more gains might send the price towards the $28,000 zone. If there is no upside break, the price might start a downside correction below $24,400. The next key support is near the $23,000 level. It is close to the 50% Fib retracement level of the upward move from the $19,568 swing low to $26,533 high. Any more losses might call for a move towards the $22,000 support zone.

Bitcoin Price
Looking at the chart, bitcoin price is clearly trading above $23,500 and the 55 simple moving average (4-hours). Overall, the price could continue to rise if there is a clear move above $25,250 level in the near term.
Technical Indicators
4 hours MACD – The MACD is now losing momentum in the bullish zone.
4 hours RSI (Relative Strength Index) – The RSI is now above the 50 level.
Key Support Levels – $24,400 and $23,000.
Key Resistance Levels – $25,250, $26,500 and $28,000.
- SEO Powered Content & PR Distribution. Get Amplified Today.
- Platoblockchain. Web3 Metaverse Intelligence. Knowledge Amplified. Access Here.
- Source: https://www.livebitcoinnews.com/bitcoin-price-analysis-btc-rally-could-extend-above-26k/
- :is
- 000
- a
- above
- against
- analysis
- and
- At
- average
- bearish
- below
- Bitcoin
- Bitcoin Price
- Bitcoin Price Analysis
- Break
- BTC
- BTC/USD
- Bullish
- Bulls
- call
- Chart
- clear
- clearly
- Close
- coinbase
- comments
- continue
- could
- crucial
- data
- Dollar
- downside
- Even
- extend
- First
- follow
- For
- formed
- fresh
- fresh increase
- from
- Gain
- Gains
- High
- HOURS
- HTTPS
- Hurdles
- immediate
- in
- Increase
- index
- internal
- IT
- Key
- Level
- levels
- Line
- losing
- losses
- Low
- MACD
- major
- many
- might
- Momentum
- more
- move
- moving
- moving average
- Near
- next
- of
- on
- overall
- Pace
- plato
- Plato Data Intelligence
- PlatoData
- positive
- Post
- price
- Price Analysis
- rally
- recently
- relative strength index
- Resistance
- retracement
- Rise
- rsi
- Signs
- Simple
- start
- started
- steady
- strength
- support
- support levels
- TAG
- The
- to
- towards
- Trading
- TradingView
- Trend
- Upside
- upward
- us
- US Dollar
- which
- with
- zephyrnet