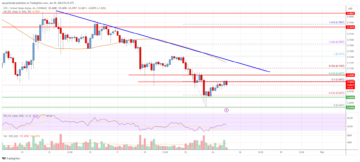
- Bitcoin price started a fresh decline below the $22,500 zone against the US Dollar.
- The price is now trading below $22,000 and the 55 simple moving average (4-hours).
- There was a break below a key bullish trend line with support near $20,850 on the 4-hours chart of the BTC/USD pair (data feed from Coinbase).
- The pair could continue to decline if there is a move below the $20,750 support.
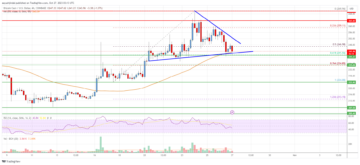
Bitcoin price is struggling below $22,000 against the US Dollar. BTC might extend losses if it stays below the $21,600 and $22,000 resistance levels.
Bitcoin Price Analysis
Bitcoin price started a major decline below the $22,800 support zone. There was a sharp bearish wave and the price even declined below the $21,500 support zone.
During the decline, there was a break below a key bullish trend line with support near $20,850 on the 4-hours chart of the BTC/USD pair. The pair traded below the 50% Fib retracement level of the upward move from the $18,892 swing low to $24,287 high.
It is now trading below $22,000 and the 55 simple moving average (4-hours). It is also consolidating near the 61.8% Fib retracement level of the upward move from the $18,892 swing low to $24,287 high.
An immediate resistance on the upside is near the $21,450 level. The first major resistance is near the $21,600 level. The next major resistance on the upside is near the $22,000 level, above which the price could rise towards the $22,800 zone. Any more gains might send the price towards the $24,000 zone.
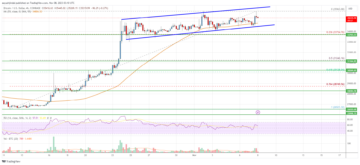
If there is no upside break, the price might continue to decline below $21,000. The next key support is near the $20,750 level, below which the price might accelerate lower. In the stated case, the price could decline towards the $19,000 level. Any more losses might call for a move towards the $18,500 support zone in the coming sessions.
Looking at the chart, bitcoin price is clearly trading below $22,500 and the 55 simple moving average (4-hours). Overall, the price could continue to decline if there is a move below the $20,750 support in the near term.
Technical Indicators
4 hours MACD – The MACD is now gaining momentum in the bearish zone.
4 hours RSI (Relative Strength Index) – The RSI is now below the 50 level.
Key Support Levels – $20,750 and $20,000.
Key Resistance Levels – $21,450, $21,600 and $22,000.
- Bitcoin
- Bitcoin News
- blockchain
- blockchain compliance
- blockchain conference
- BTC
- coinbase
- coingenius
- Consensus
- crypto conference
- crypto mining
- cryptocurrency
- decentralized
- DeFi
- Digital Assets
- ethereum
- Live Bitcoin News
- machine learning
- news
- non fungible token
- plato
- plato ai
- Plato Data Intelligence
- Platoblockchain
- PlatoData
- platogaming
- Polygon
- proof of stake
- Trading
- W3
- zephyrnet