Published 2 hours ago
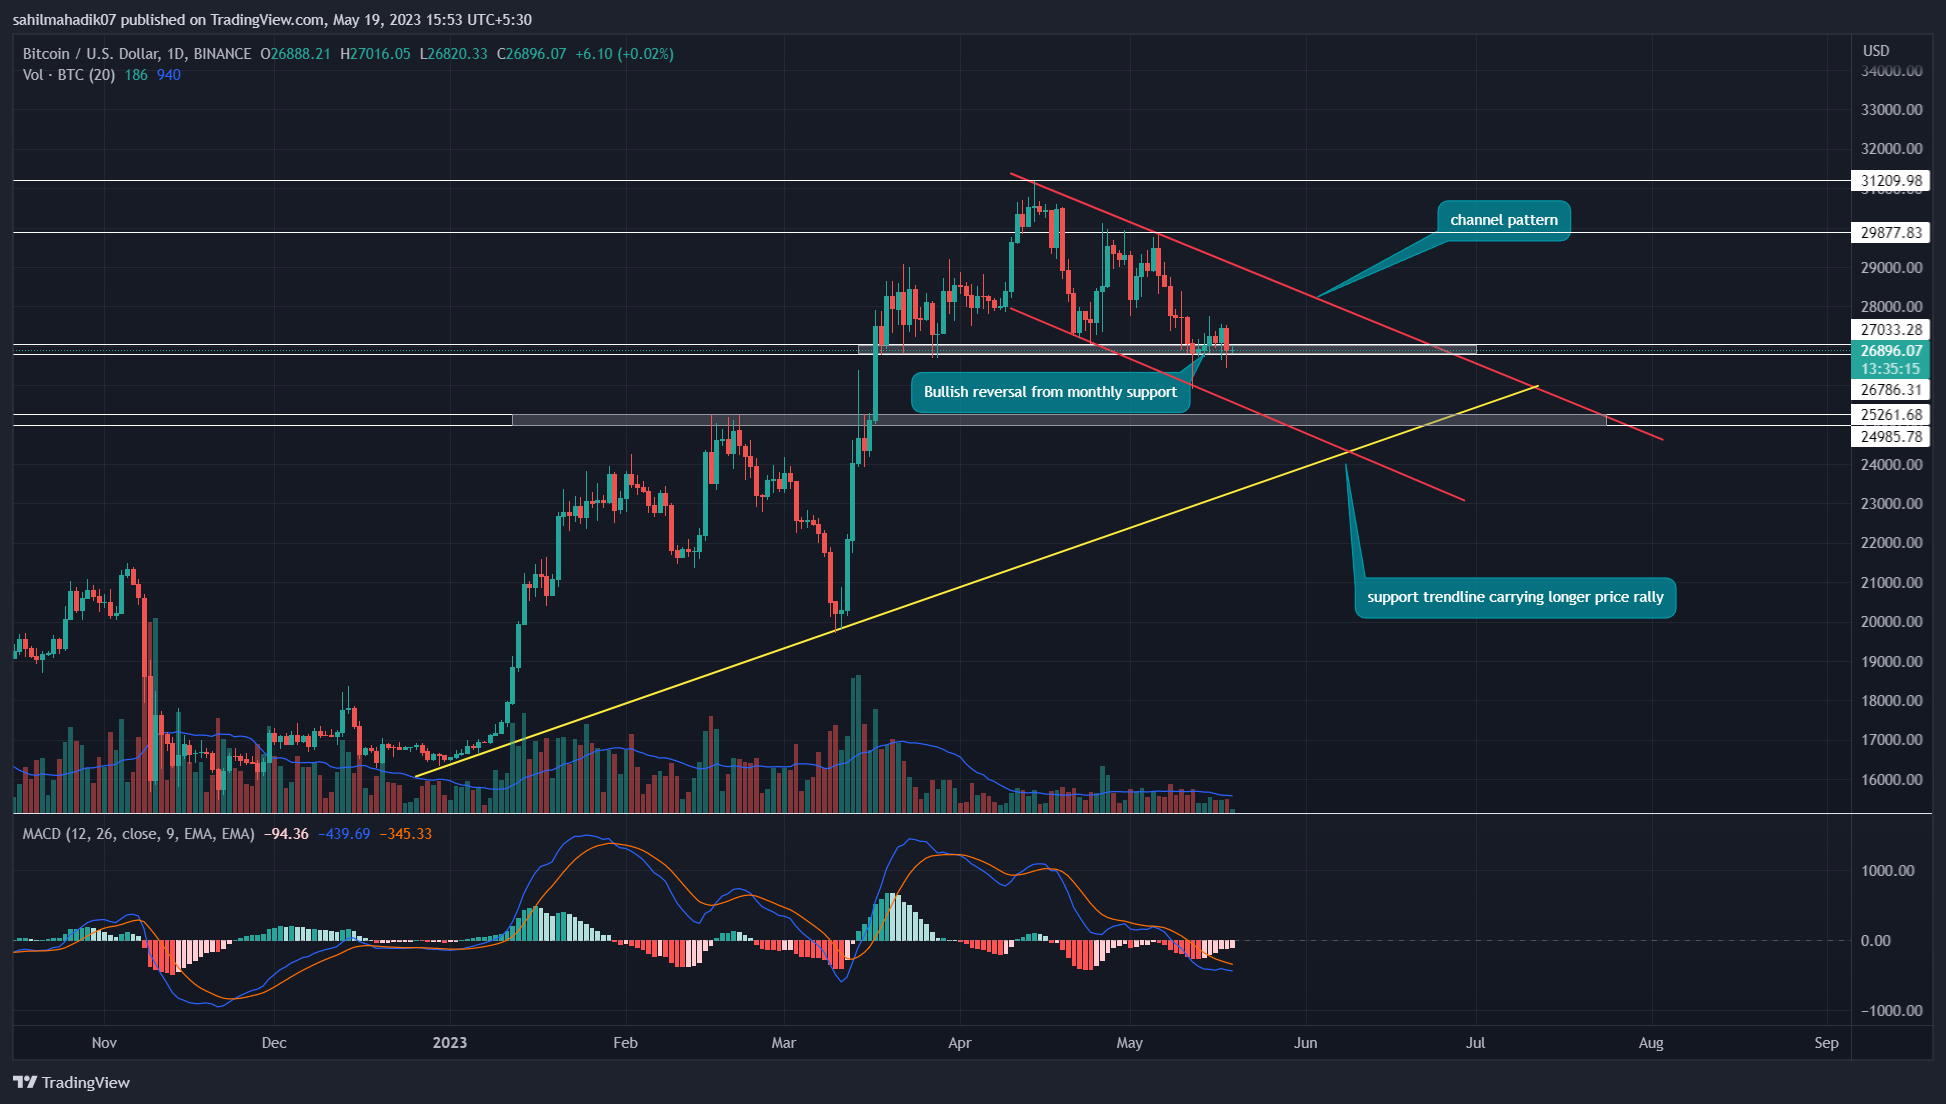
Bitcoin Price Analysis: For over a week, the Bitcoin price has been hovering above the $27000-$26780 support, showcasing indecisiveness among market participants. The daily candles with multiple lower tails reflect the buyers are accumulating at the aforementioned support. If the buying pressure persists, the BTC price will witness a minor upswing to rechallenge the resistance trendline of the channel pattern.
advertisement
Key Points:
- The ongoing correction phase is still above the 50% Fibonacci retracement level indicating the Bitcoin price is bullish in the long term.
- Several rejection candles at the $27000 level validate it as a strong demand zone.
- The intraday trading volume in Bitcoin is $14.3 Billion, indicating a 4% loss.
Source-Tradingview
By press time, the Bitcoin price traded at the $26894 mark with an insignificant gain of 0.01%. The prices still moving sideways above $27000-$26780 support keeps several cryptocurrencies in uncertainty.
However, in the midst of the current consolidation, the BTC price showed a reversal from the support trendline of the channel pattern. This reversal and strong support from $27000 suggest the coin price is likely to rise high in coming trading sessions.
Also Read: Top BRC – 20 Tokens Set To Take The Next Big Leap
The potential rally may surge the prices 7% higher to hit the channel pattern’s resistance trendline. However, until this overhead trendline is intact, the Bitcoin price may extend the correction phase to lower levels.
Thus, a breakout above the resistance trendline is needed to kickstart a new recovery rally that may surpass the last swing top of $31170.
Technical Indicator
Moving Average Convergence Divergence: The MACD(blue) and signal(orange) line goes flattish accentuating the sideways trend in the market.
Bollinger Band: The lower back of the BB indicator showing a downslope indicates the bearish momentum in the market is still aggressive.
Bitcoin Price Intraday Levels
- Spot rate: $26893
- Trend: Bullish
- Volatility: Trap
- Resistance levels- $27800 and $29800
- Support levels- $26786 and $25200
Share this article on:
advertisement
The presented content may include the personal opinion of the author and is subject to market condition. Do your market research before investing in cryptocurrencies. The author or the publication does not hold any responsibility for your personal financial loss.
<!– Close Story–>
- SEO Powered Content & PR Distribution. Get Amplified Today.
- PlatoAiStream. Web3 Data Intelligence. Knowledge Amplified. Access Here.
- Minting the Future w Adryenn Ashley. Access Here.
- Buy and Sell Shares in PRE-IPO Companies with PREIPO®. Access Here.
- Source: https://coingape.com/markets/bitcoin-price-analysis-crucial-levels-to-watch-as-btc-price-goes-flattish-amid-market-fud/
- :has
- :is
- :not
- 1
- 12
- 20
- 200
- 39
- 7
- 8
- 9
- a
- above
- Ad
- aggressive
- ago
- am
- Amid
- among
- an
- analysis
- and
- any
- ARE
- article
- AS
- At
- author
- avatar
- average
- back
- BAND
- bearish
- Bearish Momentum
- Beauty
- been
- before
- Big
- Billion
- Bitcoin
- Bitcoin Price
- Bitcoin Price Analysis
- Bitcoin price prediction
- blockchain
- Blue
- breakout
- Brian
- BTC
- btc price
- Bullish
- buyers
- Buying
- Candles
- Channel
- Coin
- Coingape
- COM
- coming
- condition
- consolidation
- content
- Convergence
- correction phase
- crucial
- cryptocurrencies
- cryptocurrency
- Current
- daily
- Demand
- different
- Divergence
- do
- does
- Entertainment
- Ether (ETH)
- extend
- Fashion
- Fibonacci
- finance
- financial
- follow
- For
- from
- FUD
- Gain
- Goes
- Have
- High
- higher
- Hit
- hold
- HOURS
- However
- HTTPS
- i
- if
- in
- include
- Including
- indicates
- investing
- IT
- journalism
- jpg
- Last
- Level
- levels
- likely
- Line
- Long
- loss
- mark
- Market
- market research
- May..
- minor
- Momentum
- moving
- multiple
- needed
- New
- next
- of
- on
- ongoing
- Opinion
- or
- Orange
- out
- over
- participants
- past
- Pattern
- persists
- personal
- phase
- plato
- Plato Data Intelligence
- PlatoData
- plugin
- points
- potential
- prediction
- presented
- press
- pressure
- price
- Price Analysis
- Price Prediction
- Prices
- Publication
- rally
- Rate
- reach
- Read
- recovery
- reflect
- research
- Resistance
- responsibility
- retracement
- Reversal
- Rise
- sessions
- set
- several
- Share
- showcasing
- showed
- sideways
- Still
- strong
- subject
- suggest
- support
- surge
- surpass
- Swing
- Take
- term
- that
- The
- this
- time
- to
- Tokens
- top
- Topics
- traded
- Trading
- Trading sessions
- trading volume
- TradingView
- Trend
- Uncertainty
- until
- VALIDATE
- variety
- volume
- Watch
- week
- will
- with
- witness
- working
- written
- years
- Your
- zephyrnet