Bitcoin price is facing resistance near the $21,500 zone. BTC could correct lower if there is a clear move below the $20,880 support zone.
- Bitcoin seems to be facing a strong resistance near the $21,450 and $21,500 levels.
- The price is trading above $20,500 and the 100 hourly simple moving average.
- There is a key bullish trend line forming with support near $20,920 on the hourly chart of the BTC/USD pair (data feed from Kraken).
- The pair could start a downside correction below the $20,880 and $20,750 support levels.
Bitcoin Price Faces Resistance
Bitcoin price started a strong increase above the $20,000 resistance zone. BTC was able to climb above the $20,500 and $21,000 levels to start a major uptrend.
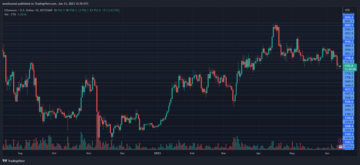
Finally, the price tested the $21,500 resistance zone. A high is formed near $21,485 and the price is now consolidating gains. There was a minor decline below the $21,200 level. The price declined below the 23.6% Fib retracement level of the upward wave from the $20,249 swing low to $21,489 high.
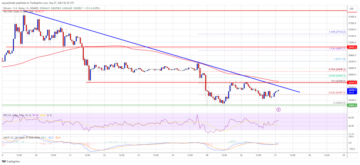
Bitcoin price is now trading above $20,500 and the 100 hourly simple moving average. There is also a key bullish trend line forming with support near $20,920 on the hourly chart of the BTC/USD pair.

Source: BTCUSD on TradingView.com
On the upside, an immediate resistance is near the $21,250 level. The next major resistance is near the $21,500 zone, above which the price might start another steady increase. In the stated case, the price may perhaps rise towards the $22,000 level. Any more gains might send btc price towards the $22,500 level.
Downside Correction in BTC?
If bitcoin price fails to clear the $21,500 resistance, it could slowly move down. An immediate support on the downside is near the $21,000 zone and the trend line.
The next major support is near the $20,720 level. It is near the 61.8% Fib retracement level of the upward wave from the $20,249 swing low to $21,489 high. The main support is now forming near the $20,500 level, below which the price might retest $20,000. Any more losses might send the price to $19,000.
Technical indicators:
Hourly MACD – The MACD is now losing pace in the bullish zone.
Hourly RSI (Relative Strength Index) – The RSI for BTC/USD is now above the 50 level.
Major Support Levels – $20,720, followed by $20,500.
Major Resistance Levels – $21,250, $21,500 and $22,000.
- SEO Powered Content & PR Distribution. Get Amplified Today.
- Platoblockchain. Web3 Metaverse Intelligence. Knowledge Amplified. Access Here.
- Source: https://newsbtc.com/analysis/btc/bitcoin-price-consolidates-21k-2/
- 000
- 100
- a
- Able
- above
- and
- Another
- average
- below
- Bitcoin
- Bitcoin Price
- BTC
- btc price
- BTC/USD
- Bullish
- case
- Chart
- clear
- climb
- Consolidates
- consolidating
- could
- data
- Decline
- down
- downside
- faces
- facing
- fails
- followed
- formed
- from
- Gains
- High
- HTTPS
- immediate
- in
- Increase
- index
- Indicators
- IT
- Key
- Kraken
- Level
- levels
- Line
- losing
- losses
- Low
- MACD
- Main
- major
- max-width
- might
- minor
- more
- move
- moving
- moving average
- Near
- next
- Pace
- perhaps
- plato
- Plato Data Intelligence
- PlatoData
- price
- pullback
- relative strength index
- Resistance
- retracement
- Rise
- Risk
- rsi
- seems
- Simple
- Slowly
- start
- started
- stated
- steady
- strength
- strong
- support
- support levels
- The
- to
- towards
- Trading
- TradingView
- Trend
- Upside
- uptrend
- upward
- Wave
- which
- zephyrnet