Bitcoin Price Prediction – August 27
The Bitcoin price prediction is caught in the middle of a bull market as the coin rises to trade above the $47,000 resistance level.
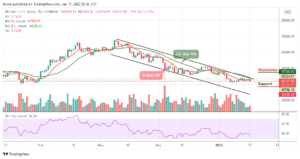
BTC/USD Long-term Trend: Bullish (Daily Chart)
Key levels:
Resistance Levels: $51,000, $53,000, $55,000
Support Levels: $43,000, $41,000, $3,000

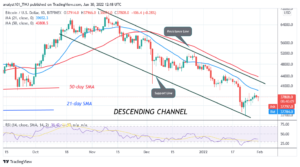
BTC/USD is currently on the rise as the recent move marks a breakthrough in the recently observed upward movement of the consolidation period, but it is important to note that the price of Bitcoin has not breached any major technical levels. Therefore, BTC/USD is trying to start the bullish move since the beginning of the European session but struggles to gain momentum as the uptrend across the market comes to a halt.
Bitcoin Price Prediction: Where Could BTC Go Next?
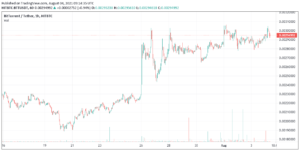
At the time of writing, the Bitcoin price is trading up 1.15% at its current price of $47,392 level. Moreover, as the resistance mounts, the positive movement towards $48,000 may likely come into focus and the next few days could reveal where Bitcoin (BTC) and other altcoins will trend for as the new month begins.
However, if the bulls push the price above the 9-day moving average, moving up further to cross the upper boundary of the channel could push the price above the next level which may likely touch the resistance levels of $51,000, $53,000, and $55,000. Similarly, the technical indicator Relative Strength Index (14) is likely to cross above 60-level, suggesting additional bullish signals into the market.
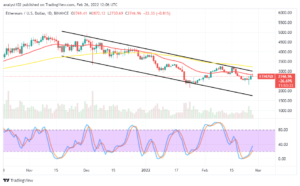
BTC/USD Medium – Term Trend: Ranging (4H Chart)
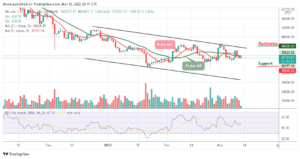
Looking at the 4-hour chart, BTC/USD is trading at $47,175 as all eyes are glued to the $48,000 resistance level. Presently, the Bitcoin price is seen moving above the 9-day moving average while the existing trend is still bearish. However, the buyers may need to push the price above the 21-day moving average for them to control the market but rapid price actions may likely play out.

At the time of writing, the red-line of 9-day MA is still below the green-line of 21-day MA, and the coin may likely retest the support level of $45,500 and below if the price crosses below the lower boundary of the channel. Meanwhile, if the technical indicator Relative Strength Index (14) follows the upward movement above 50-level, BTC/USD may likely hit the resistance level of $49,500 and above.
Looking to buy or trade Bitcoin (BTC) now? Invest at eToro!
75% of retail investor accounts lose money when trading CFDs with this provider
Source: https://insidebitcoins.com/news/bitcoin-price-prediction-btc-usd-climbs-past-47000
- 000
- Additional
- All
- Altcoins
- AUGUST
- bearish
- Bitcoin
- Bitcoin Price
- Bitcoin price prediction
- BTC
- BTC/USD
- Bullish
- Bulls
- buy
- caught
- Coin
- consolidation
- Current
- European
- Focus
- HTTPS
- index
- investor
- IT
- Level
- major
- Market
- medium
- Momentum
- money
- move
- Other
- prediction
- price
- Price Prediction
- retail
- start
- support
- support level
- Technical
- time
- touch
- trade
- Trading
- writing