Bitcoin Price Prediction – August 13
The Bitcoin price prediction shows that BTC bulls’ comeback is likely to send the price towards the resistance level of $50,000.
BTC/USD Long-term Trend: Bullish (Daily Chart)
Key levels:
Resistance Levels: $52,000, $54,000, $56,000
Support Levels: $40,000, $38,000, $36,000

The daily chart has revealed that BTC/USD is back to trading above $46,000 following a bearish correction. Today, the Asian session is characterized by a renewed upward trend whereby BTC/USD has recovered from intraday lows at $44,249 to highs around $46,691. Moreover, Bitcoin price is currently hovering 4.55% higher on the day at $46,444 above the 9-day and 21-day moving averages.
Bitcoin Price Prediction: Bitcoin (BTC) Needs to Move Above $50,000
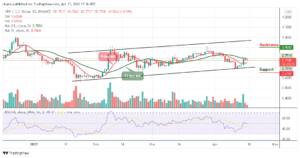
At the time of writing, the Bitcoin price is trading around the upper boundary of the channel. On a bullish note, looking at the technical indicator, the Relative Strength Index (14), the signal line is moving back into the overbought region which suggests that the Bitcoin price will once again move towards $50,000, which is the potential resistance level.
However, a strong bullish movement above the channel may take the price to the resistance levels of $52,000, $54,000, and $56,000. Moreover, if the market makes a quick turn to the south, the BTC/USD may likely drop to $42,000, and should this support fails to contain the sell-off, traders may see a further roll back to $40,000, $38,000, and critically $36,000.
BTC/USD Medium – Term Trend: Bullish (4H Chart)
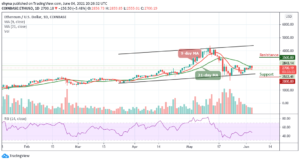
Following the 4-hour chart, Bitcoin (BTC) bulls have now stepped back into the market pushing the price above $46,000. Although the Bitcoin price has not yet closed above $46,000, it’s still in the loop of making a reversal. However, the Bitcoin price hovers around $46,323 and may take time to persistently trade above $48,000.

At the moment, BTC/USD is currently moving above the 9-day and 21-day moving averages. More so, as the technical indicator Relative Strength Index (14) moves above 60-level, the upward movement may likely push the price to the nearest resistance level at $49,000 and above while the immediate support lies at $44,000 and below.
Looking to buy or trade Bitcoin (BTC) now? Invest at eToro!
75% of retail investor accounts lose money when trading CFDs with this provider
Source: https://insidebitcoins.com/news/bitcoin-price-prediction-btc-usd-eyes-48000-resistance-level