Bitcoin Price Prediction – January 27
The Bitcoin price prediction shows that BTC begins another break down and the price could hit the support level of $35,500.
BTC/USD Long-term Trend: Bearish (Daily Chart)
Key levels:
Resistance Levels: $42,500, $44,500, $46,500
Support Levels: $30,500, $28,500, $26,500

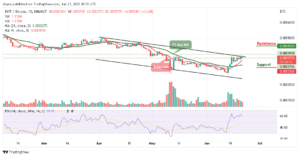
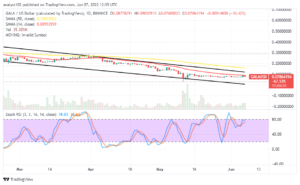
BTC/USD is resuming back into a selling mode, after an erratic recovery during the past few days. However, the coin touched the resistance level at $38,960 yesterday and has been in retreat ever since. At the time of writing, BTC/USD is trading at $36,537, down 0.82% below the 9-day moving average. The first digital asset continues to move towards the lower boundary of the channel.
Bitcoin Price Prediction: Bitcoin (BTC) Remains at the Downside
The Bitcoin price is struggling to hold a couple of important supports near $35,500 and the price is likely to continue lower below the 9-day and 21-day moving averages. If there is a downside break below the $35,000 support level, the price could visit the $34,000 support level. The bears are gaining momentum and if the price clears the $33,000 support, there is a risk of a sharp decline below the lower boundary of the channel as the king coin could hit the support levels of $30,500, $28,500, and $26,500 respectively.
However, the market is deciding below the 9-day and 21-day moving averages, where the buyers could anticipate a rebound. Meanwhile, the $38,000 and $40,000 levels may further surface as potential resistances should the $37,000 level holds. However, a strong bullish spike might take the price to $42,500, $44,500, and $46,500 levels. But presently, the technical indicator Relative Strength Index (14) is returning into the oversold region.
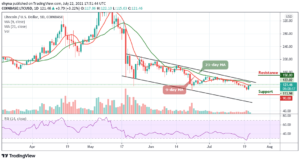
BTC/USD Medium – Term Trend: Bearish (4H Chart)
Following the 4-hour chart, Bitcoin bears are now pushing the price above its previous resistance level that exists above the 21-day moving average. Although, the Bitcoin price has not been able to slide below $35,000 and it’s still in the loop of making a bounce above the 9-day moving average. Its price hovers around $36,777 and may take time to persistently trade above the upper boundary of the channel.

However, BTC/USD is currently moving within the 9-day and 21-day moving averages and further upward movement may likely push the price near the $40,000, $42,000, and $44,000 resistance levels while the immediate support lies at $34,000, $32,000, and $30,000. The technical indicator Relative Strength Index (14) moves around 50-level, which may allow the market to move sideways.
Looking to buy or trade Bitcoin (BTC) now? Invest at eToro!
68% of retail investor accounts lose money when trading CFDs with this provider
Read more:
- "
- 000
- Although
- around
- asset
- average
- bearish
- Bears
- Bitcoin
- Bitcoin Price
- Bitcoin price prediction
- BTC
- BTC/USD
- Bullish
- buy
- buy bitcoin
- Coin
- continue
- continues
- could
- Couple
- digital
- Digital Asset
- down
- First
- hold
- HTTPS
- important
- index
- investor
- IT
- January
- King
- Level
- Making
- Market
- medium
- Momentum
- money
- move
- Near
- prediction
- price
- Price Prediction
- public
- recovery
- retail
- Risk
- strong
- support
- support level
- Supports
- Surface
- Technical
- time
- trade
- Trading
- W3
- within
- writing