Bitcoin Price Prediction – May 26
The Bitcoin price is now up nearly three percent over the past 24 hours, currently trading at $39,307 after touching the daily high of $40,855.
BTC/USD Long-term Trend: Bearish (Daily Chart)
Key levels:
Resistance Levels: $48,000, $53,000, $58,000
Support Levels: $31,000, $26,000, $21,000
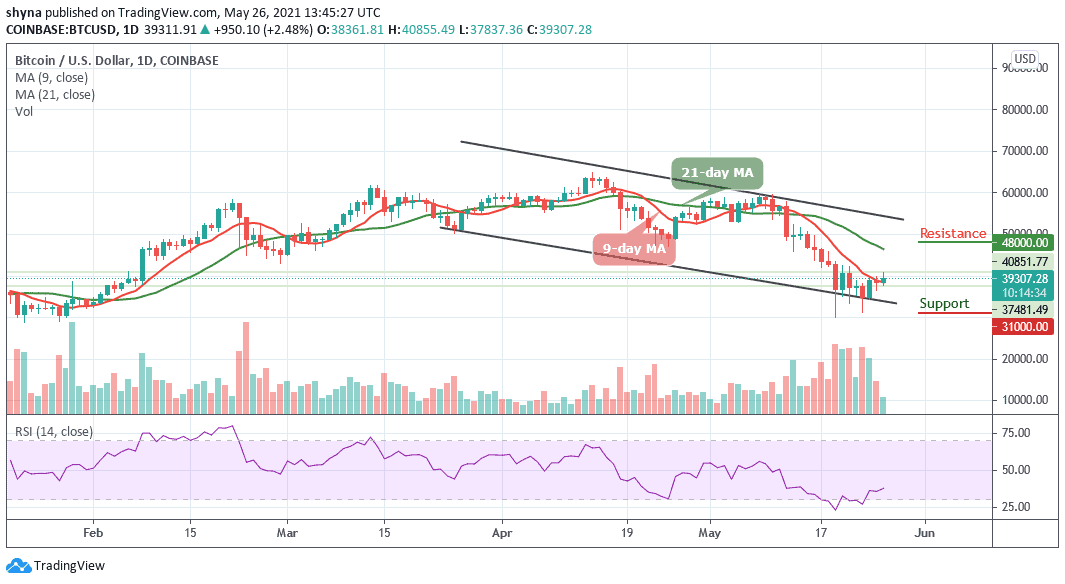
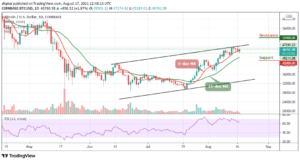
According to the daily chart, BTC/USD is heading northwards as the coin moves past $40,000 levels during the European session. Meanwhile, at the time of writing, the Bitcoin price is hovering at $39,307 above the 9-day moving average. For the past 3 days, Bitcoin has proved to investors that it can come out of the ditch it fell into last week by gaining considerable ground to $40,000.
Bitcoin Price Prediction: What is the Next Direction for BTC?
The increasing skepticism in the market limits Bitcoin’s ability to continue with the uptrend as the daily chart reveals. Meanwhile, the Bitcoin price corrected from highs around $40,000 resistance but secured support at $36,500. In the meantime, the Bitcoin price has recoiled above $39,000 and is in the process of brushing shoulders with $40,000. Therefore, a confirmed break above $40,000 is required to validate the uptrend towards the resistance level of $50,000.
However, since the Bitcoin price has managed to reach a daily high close of $40,900. The main resistance levels may be found at $42,000 and $44,000. The technical indicators provide some bullish signs as the Relative Strength Index (14) is likely to cross above 36-level to generate more bullish signals. Once this is down, the resistance levels of$48,000, $53,000, and $58,000 may come to play.
In other words, if the Bitcoin price crosses below the lower boundary of the channel, it could therefore move to touch the critical supports at $31,000, $26,000, and $21,000 respectively.
BTC/USD Medium – Term Trend: Bearish (4H Chart)
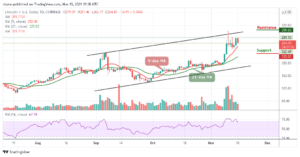
The 4-hour chart reveals that the Bitcoin price failed to cross above the upper boundary of the channel and if the price continues to fall further and cross below the 9-day and 21-day moving averages; it could reach the supports at $35,000 and below.
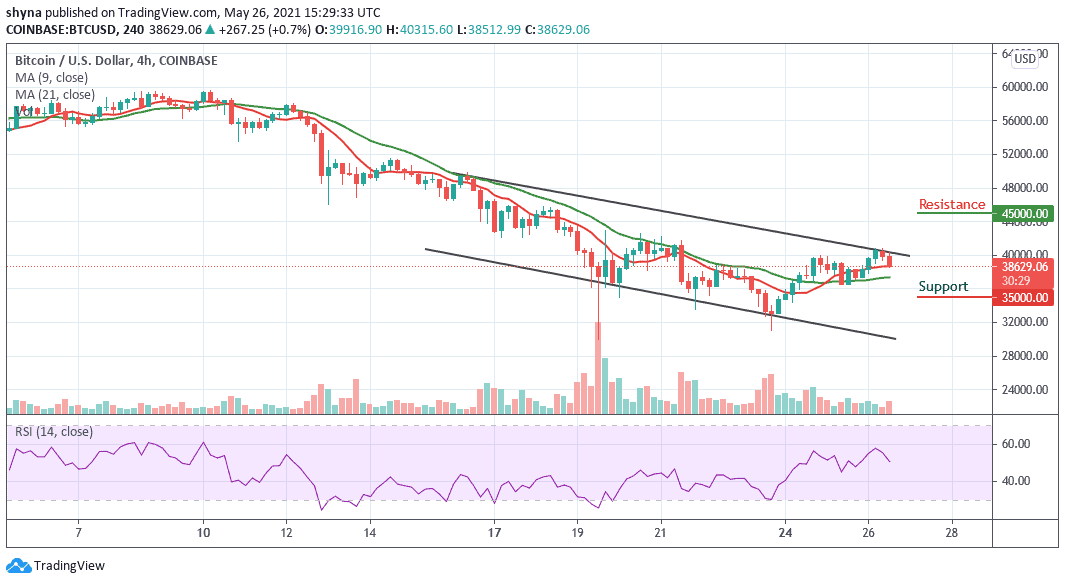
Moreover, if the buyers push the coin above the upper boundary of the channel, the Bitcoin price could reach the nearest resistance level at $45,000 and above. On the other hand, the technical indicator Relative Strength Index (14) is seen moving below the 50-level, further bearish movement may welcome negative signals into the market.