Bitcoin Price Prediction – November 4
The Bitcoin price slumps below the resistance level of $63,114. Further downside momentum may come to play but $60,000 may likely come out as support.
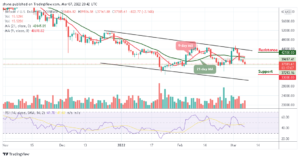
BTC/USD Long-term Trend: Ranging (Daily Chart)
Key levels:
Resistance Levels: $68,000, $70,000, $72,000
Support Levels: $55,000, $53,000, $51,000

BTC/USD range-bounds with the selling pressure seen around $61,114 level which is stopping it from seeing any major gains. Meanwhile, traders are not surprised with the selling pressure as bears are trying to defend against a break above the 9-day and 21-day moving averages. However, until bulls keep the price above this barrier, the Bitcoin price may continue to face a prolonged sideways movement or drop below the current market value.
Bitcoin Price Prediction: Bitcoin May Revisit the Downtrends
The Bitcoin price may likely slide below the 9-day and 21-day moving averages as the daily chart shows; however, a further retracement seems imminent and it is likely to break below $61,000. Meanwhile, $55,000, $53,000, and $51,000 serve as the major support levels, making room for BTC to fall even further. The technical indicator Relative Strength Index (14) is sliding below 55-level, suggesting bearish movement.
However, as the daily chart reveals, if the bulls could push the price back above the daily high at $63,100, BTC/USD may see a potential resistance level at $64,000, therefore, any further movement towards the upper boundary of the channel could send it to other resistance levels at $68,000, $70,000, and $72,000 respectively.

BTC/USD Medium-Term Trend: Ranging (4H Chart)
Looking at the 4-hour chart, the bears are coming back into the market as the market price moves below the 9-day and 21-day moving averages. The bulls failed to hold the Bitcoin price above the moving averages. Meanwhile, if BTC/USD breaks above the moving averages, the $63,000 and above may come into play.

However, if the price breaks below the lower boundary of the channel and falls more, the support levels of $60,000 and below may be in focus. Meanwhile, as the Relative Strength Index (14) nosedives below 45-level, more bearish signals may play out before a rebound could come in.
Looking to buy or trade Bitcoin (BTC) now? Invest at eToro!
68% of retail investor accounts lose money when trading CFDs with this provider
Read more: