Bitcoin Price Prediction – June 4
The Bitcoin price is falling again in a narrow channel after consolidating, but buying interest could pick up if the price approaches $40,000.
BTC/USD Long-term Trend: Ranging (Daily Chart)
Key levels:
Resistance Levels: $45,000, $50,000, $55,000
Support Levels: $30,000, $25,000, $20,000

During the European session today, BTC/USD started trading from the opening price of $39,248 and now dropping below the support level of $37000 at the time of writing. However, the psychological barrier of $40,000 still serves as the first important resistance within the market and a sustainable move above 9-day and 21-day moving averages may likely push the price towards the resistance level of $40,000.
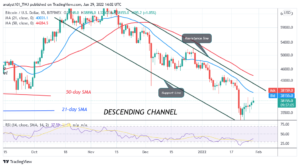
Bitcoin Price Prediction: Will Bitcoin (BTC) Drop More?
On the intraday chart, the Bitcoin price breaks below the 9-day and 21-day moving averages, which increased the selling pressure. At the time of writing, BTC/USD is hovering at the support created below the $36,800 and if this is cleared, the sell-off may be extended to $33,000 which is around the 21-day moving average. Meanwhile, the dips to $35,000 are likely to be bought, which means the overall bullish sentiments may prevail.
Moreover, if the price moves below the mentioned support, $32,000 could come into focus which served as a support during the previous consolidation period while the critical supports lie at $30,000, $25,000, and $20,000. Looking at the upside, the first resistance may likely come at $40,000 if the king coin rebounded. Once this is done, $43,000 could come back into focus. Further bullish movement may hit the potential resistance levels at $45,000, $50,000, and $55,500 as the Relative Strength Index (14) moves below 45-level.
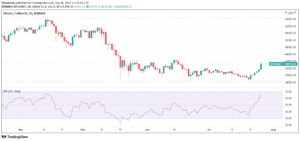
BTC/USD Medium-Term Trend: Ranging (4H Chart)
The 4-hour chart shows that the Bitcoin bears are still in play within the market keeping the Bitcoin price below the 9-day and 21-day moving averages. Although BTC/USD has not yet slipped below $35,000, it’s still in the loop of making a bounce back.

Looking to buy or trade Bitcoin (BTC) now? Invest at eToro!
75% of retail investor accounts lose money when trading CFDs with this provider
Moreover, the Bitcoin price is currently hovering below the 9-day and 21-day moving averages at the time of writing. The upward movement may likely push the price to the nearest resistance of $39,500 and above while the immediate support lies at $35,500 and below. The Relative Strength Index (14) is moving around the 47-level, which indicates sideways movement.
- 000
- around
- Bears
- Bitcoin
- Bitcoin Price
- Bitcoin price prediction
- BTC
- BTC/USD
- Bullish
- buy
- Buying
- Coin
- consolidation
- Drop
- European
- First
- Focus
- HTTPS
- index
- interest
- investor
- keeping
- King
- Level
- Making
- Market
- money
- move
- prediction
- pressure
- price
- Price Prediction
- retail
- started
- support
- support level
- Supports
- sustainable
- Target
- time
- trade
- Trading
- within
- writing