Bitcoin Price Prediction – June 7
The Bitcoin price retested the $35,000 support level as it is now rising, but it must clear $37,000 and the moving averages for a steady increase.
BTC/USD Long-term Trend: Bearish (Daily Chart)
Key levels:
Resistance Levels: $42,000, $44,000, $46,000
Support Levels: $31,000, $29,000, $27,000

BTC/USD is currently recovering higher from the $35,000 support zone and the first digital asset must clear $37,000 resistance above the 9-day and 21-day moving averages to start a fresh increase in the near term. Looking at the daily chart, traders could see that BTC is yet to break above the 9-day moving average. The implication is that the market may drop to retest the $33,000 support. This is possible if the sellers reclaim the $35,000 crucial support level and in most cases, sellers may find penetration difficult at this level.
Bitcoin Price Prediction: Would BTC Climb Higher this time?
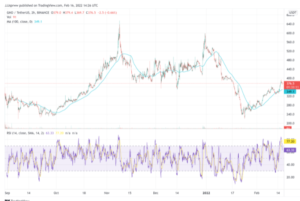
As reveals by the daily chart, the Bitcoin price hiked to a new weekly high touching the resistance level of $36,812 at the opening of today’s market. In the meantime, traders could see that the Bitcoin price has continued to converge above the key level of $36,000. The 9-day MA trend-line is ready to cross above the green trend-line of the 21-day MA as they prepare to face the north. The Relative Strength Index (14) moves toward 40-level in an attempt to probably cross back to the north. That signals that the return of a bullish uptrend may likely play out.
The first major resistance is near the $38,500 level while the main resistance is still near the $40,000 level. Therefore, a clear break above the $40,000 level could set the pace for a larger increase to $42,000, $44,000, and $46,000 resistance levels. On the contrary, should Bitcoin price fail to clear the $37,000 resistance, it could start a new decline as the initial support on the downside is near the $35,500 level. If there is a downside break below the $33,500 support and $32,000, the price could start a sharp decline towards the support levels of $31,000, $29,000, and $27,000 respectively.
BTC/USD Medium – Term Trend: Ranging (4H Chart)
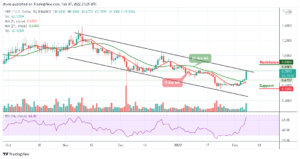
The 4-hour chart for BTC is still looking bullish as the market has been showing a sign of a bullish trend since the daily opening. However, the intraday trading is still looking bullish; following the recent rebound at $35,258 which is now a key support level. The next key support levels are $35,000 and below.

However, considering the recent sharp rebound, the Bitcoin price may continue the bullish rally to $37,000 resistance. A climb above the mentioned resistance may further push the BTC price to the resistance levels of $38,000 and above. As it appeared now, it seems the bears may likely return into the market as the Relative Strength Index (14) is now revealed moving around 48-level, suggesting sideways movement.
Looking to buy or trade Bitcoin (BTC) now? Invest at eToro!
75% of retail investor accounts lose money when trading CFDs with this provider
- 000
- around
- asset
- bearish
- Bears
- Bitcoin
- Bitcoin BTC
- Bitcoin Price
- Bitcoin price prediction
- BTC
- btc price
- BTC/USD
- Bullish
- buy
- cases
- continue
- digital
- Digital Asset
- Drop
- Face
- First
- fresh
- Green
- High
- HTTPS
- Increase
- index
- investor
- IT
- Key
- Level
- major
- Market
- medium
- money
- moves
- Near
- North
- prediction
- price
- Price Prediction
- rally
- retail
- Sellers
- set
- start
- support
- support level
- time
- trade
- Traders
- Trading
- weekly