Bitcoin Price Prediction – July 5
The Bitcoin price prediction becomes a sea of red, with nearly all assets suffering in the greater market collapse
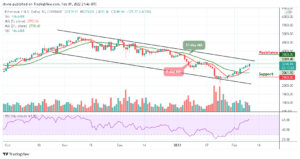
BTC/USD Long-term Trend: Ranging (Daily Chart)
Key levels:
Resistance Levels: $39,000, $41,000, $43,000
Support Levels: $30,000, $28,000, $26,000

BTC/USD has been struggling to maintain its position above $35,000 as the coin sees another dive below the $34,000 level today. The Bitcoin price is in a dangerous position as the price slips below the 9-day and 21-day moving averages during the early Asian hours. If the breakthrough is confirmed, the downside momentum will gain traction with the next focus on $32,500.
Bitcoin Price Prediction: Where is BTC Price Going Next?
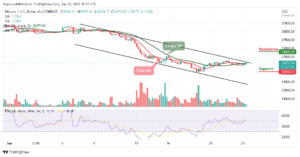
At the time of writing, the Bitcoin price is trading below the 9-day and 21-day moving averages at $33,834 with a decline of 4.09% on the daily price chart. However, looking at the declining daily volume candles, together with the steady but stable recent Bitcoin price action, traders can assume that a stronger negative move may be coming soon. At the moment, the Relative Strength Index (14) is seen moving below 50-level, which may likely create more downtrends.
Looking at the daily chart, BTC/USD is struggling to maintain the $33,000 support level. If the coin fails to remain above this level, then, it could drop to the next support levels of $30,000, $28,000, and $26,000. From above, maintaining the $33,000 level could send the coin to retest old support turned resistance levels at $35,500. The further movement could go above the significant 9-day and 21-day moving averages, which could send the price towards the resistance levels of $39,000, $41,000, and $43,000.
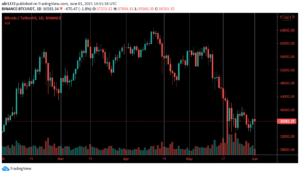
BTC/USD Medium – Term Trend: Ranging (4H Chart)
Looking at the 4-hour chart, the bulls are trying to defend the $30,000 support. Meanwhile, the $32,500 and below may come into play if BTC breaks below the lower boundary of the channel.

However, if the buyers can push the market price above the 9-day and 21-day moving averages, traders may expect a retest at the $35,000 resistance level, and breaking this level may further allow the bulls to reach $35,500 and above. The Relative Strength Index (14) is at the 47-level, suggesting sideways movement.
Looking to buy or trade Bitcoin (BTC) now? Invest at eToro!
75% of retail investor accounts lose money when trading CFDs with this provider
Source: https://insidebitcoins.com/news/bitcoin-price-prediction-btc-usd-stays-below-35000