Bitcoin Price Prediction – November 10
The Bitcoin price approaches $69,000 in a new bull-run that follows a recent dip to the support at $66,000 which happens to be the daily low.
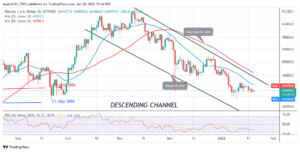
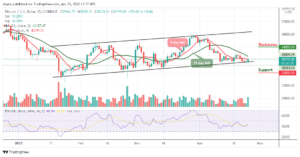
BTC/USD Long-term Trend: Bullish (Daily Chart)
Key levels:
Resistance Levels: $72,000, $74,000, $76,000
Support Levels: $63,000, $61,000, $59,000

After touching the daily low of $66,000 today, BTC/USD soars back to hit the resistance level of $69,000 for the first time in the history of the coin. With this, BTC marks a fresh 2021 high which is very close to the potential resistance level of $70,000. However, BTC/USD is likely to face strong resistance at $69,500, which could be followed by $70,000 and it is believed to consolidate and retest support at $68,000 and $67,000.
Bitcoin Price Prediction: Would Bitcoin (BTC) Reach $70k?
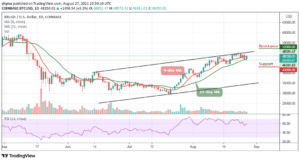
At the time of writing, the Bitcoin price is hovering at $68,397.92 but if the bulls could successfully push the price above the upper boundary of the channel, the next resistance levels may be located at resistance levels of $72,000, $74,000 and $76,400. Moreover, when the new uptrends are beginning to form, traders could use both the 9-day and 21-day moving averages as the nearest support level.
In other words, any failure by the bulls to move the price up may see a price cut to $68,000 vital support. A further low drive could send the price to the support levels of $63,000, $61,000 and $59,000. Presently, the bulls are still dominating the market and BTC/USD price may continue to follow the upward trend because the technical indicator Relative Strength index (14) is about to cross into the overbought region.

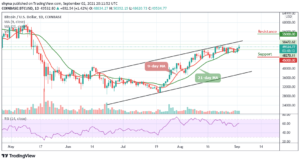
BTC/USD Medium – Term Trend: Bullish (4H Chart)
Looking at the 4-hour chart, the bears wanted to step back into the market by bringing the price to $66,000 level, but the bulls quickly held the support by picking the price from there to touch the high at $68,691 before getting to where it is currently trading at $68,461 which is still above the 9-day moving average. Meanwhile, the $71,000 and above may come into play if BTC/USD breaks above the channel.
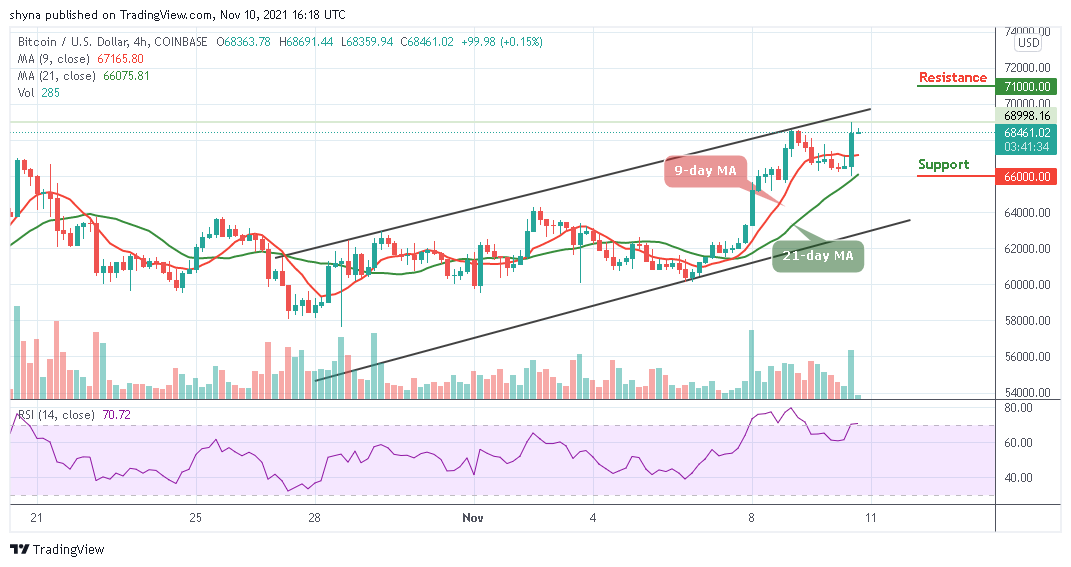
However, if the price breaks below the 9-day and 21-day moving averages; the support level of $66,000 and below may come to play. Meanwhile, as the technical indicator Relative Strength Index (14) moves into the overbought zone, more bullish signals may play out before a reversal could come in.
Looking to buy or trade Bitcoin (BTC) now? Invest at eToro!
68% of retail investor accounts lose money when trading CFDs with this provider
Read more:
- "
- 000
- All
- Bears
- Bitcoin
- Bitcoin Price
- Bitcoin price prediction
- BTC
- BTC/USD
- Bullish
- Bulls
- buy
- Coin
- continue
- Face
- Failure
- First
- first time
- follow
- form
- fresh
- High
- history
- HTTPS
- index
- investor
- IT
- Level
- Market
- medium
- money
- move
- Other
- Play
- prediction
- price
- Price Prediction
- retail
- support
- support level
- Technical
- time
- touch
- trade
- Traders
- Trading
- words
- writing