Bitcoin Price Prediction – August 18
The Bitcoin price prediction shows that the bulls may be coming back after a few heavily bearish days.
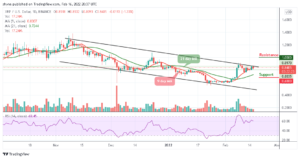
BTC/USD Long-term Trend: Ranging (Daily Chart)
Key levels:
Resistance Levels: $51,000, $53,000, $55,000
Support Levels: $41,000, $39,000, $37,000
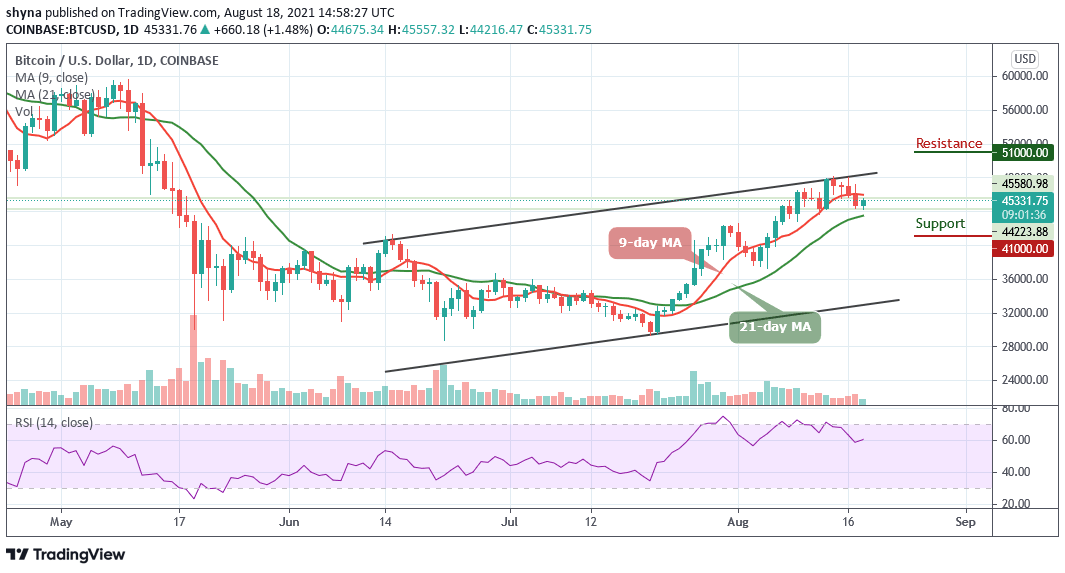
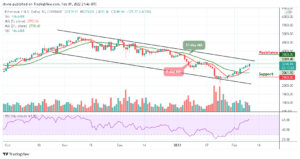
At the time of writing, BTC/USD is hovering at the resistance level of $45,331 and there have been instances in the market movement where the Bitcoin price has exchanged hands above this level. However, traders can take note that the path of least resistance is still range-bound as the daily chart shows that the coin remains within the 9-day and 21-day moving averages.
Bitcoin Price Prediction: The Bitcoin Price May Breakout to the Upside
Looking at the daily chart, the Bitcoin price may go ahead and break above the 9-day moving average but if the pennant support caves in, even $45,000 could not manage to hold as support. Therefore, BTC/USD is likely to fall to $43,000 if the coin may cross below the 21-day moving average. According to the technical indicator, the Relative Strength Index (14) is not yet done with the upside as the signal stays above 60-level. Meanwhile, there is still room that could be explored by the bulls should the RSI (14) move back into the overbought region.
From the upside, recovery may not come easy as the support will have to be sorted above the $45,000 level. Therefore, for the Bitcoin price to climb above the upper boundary of the channel, it may likely hit the potential resistance at $51,000, $53,000, and $55,000. On the other hand, if the market drops below the 21-day MA, it could reach the critical support levels at $41,000, $39,000, and $37,000.
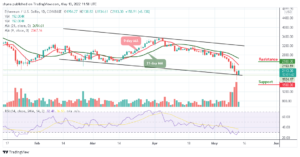
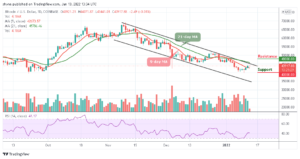
BTC/USD Medium – Term Trend: Ranging (4H Chart)
The 4-hour chart for BTC/USD is trending in a range channel formation. In the early hours of today, Bitcoin (BTC) is seen moving from $44,216 to $45,926 where the coin is currently changing hands. On the downside, we have one healthy support at $45,000. Further support could be around $44,000 and below.

However, the technical indicator Relative Strength Index (14) is moving in the same direction around 50-level. BTC/USD is hovering within the 9-day and 21-day moving averages, further bullish movements could push the price above towards the upper boundary of the channel before reaching the potential resistance at $48,000 and above.
Looking to buy or trade Bitcoin (BTC) now? Invest at eToro!
75% of retail investor accounts lose money when trading CFDs with this provider
Source: https://insidebitcoins.com/news/bitcoin-price-prediction-btc-usd-trades-around-45331