Bitcoin Price Prediction – June 9
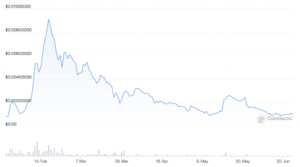
The trade worth of Bitcoin pairing with the US fiat currency currently witnesses a price upswing after featuring some lower values below its lower range-line at $35,000. As of writing, the present trading situation sees the crypto economy trading around $36,272 at an increased rate of about 8.20 percent.
BTC/USD Market
Key Levels:
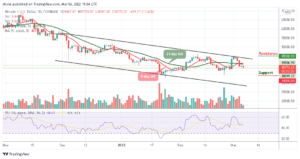
Resistance levels: $40,000, $45,000, $50,000
Support levels: $30,000, $25,000, $20,000
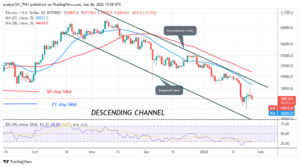
BTC/USD – Daily Chart
A bullish candlestick has been beefing up on the BTC/USD daily chart to make the crypto witnesses price upswing emerging against the lower range-bound line in today’s session. Looking at the level that the market has strived to rebound, the range-bound trading situation cannot be said to have been over. The bearish trend-line remains downward across the SMA trend lines. The 14-day SMA trend-line has briefly touched past below immediate resistance level of $40,000 as it is located underneath the 50-day SMA indicator. The Stochastic Oscillators have crossed the lines at range 40 in an attempt to point toward the north. That signifies that an upward move is in the card now.
Will the ongoing price upswing in the BTC/USD market suffice to break out of the range zones?
Going by the reading of the Stochastic Oscillator technical trading tool, the BTC/USD market has been given a signal on a promising note that an ongoing price upswing will most likely suffice in the long run. Also, more importantly, a forceful break out of the upper range and immediate resistance level of $40,000 needed to breach northward for a clearer return of a bullish trend in the crypto trading activities.
At around the points between the $40,000 and the next resistance level of $45,000, the market may experience a pit stop if a volatile move gradually emerges in the market in a bid to extend the present price upswing. In the event of that sentiment playing out, there could be a chance for bears to still find a sell entry, especially while a notable correctional move is about to be made.
Looking to buy or trade Bitcoin (BTC) now? Invest at eToro!
BTC/USD 4-hour Chart
There has been a line of upsides from a dip trading zone as is shown on the BTC/USD 4.hour chart. A bullish candlestick has formed to breach the area at which the bearish and the smaller SMA have placed downward to mark the initial lower trading point of the market. The 50-day SMA indicator is situated a bit above them. The Stochastic Oscillators have moved into the overbought region with the lines attempting to close in it. That suggests that price upswing has seemingly reached a certain capacity length that it may be necessary for it to pause or be corrected in a near time.
75% of retail investor accounts lose money when trading CFDs with this provider
Source: https://insidebitcoins.com/news/bitcoin-price-prediction-btc-usd-witnesses-price-upswing
- 000
- activities
- AREA
- around
- bearish
- Bears
- Bit
- Bitcoin
- Bitcoin Price
- Bitcoin price prediction
- breach
- BTC
- BTC/USD
- Bullish
- buy
- Capacity
- crypto
- crypto trading
- Currency
- economy
- Event
- Fiat
- Fiat currency
- HTTPS
- investor
- IT
- Level
- Line
- Long
- mark
- Market
- money
- move
- Near
- North
- prediction
- present
- price
- Price Prediction
- range
- Reading
- retail
- Run
- sees
- sell
- sentiment
- Technical
- time
- trade
- Trading
- us
- worth
- writing