Bitcoin price started a fresh decline below the $27,500 support. BTC is now showing a lot of bearish signs below the $27,400 pivot level.
- Bitcoin started a fresh decline and tumbled below the key $27,500 support zone.
- The price is trading below $27,550 and the 100 hourly Simple moving average.
- There is a major bearish trend line forming with resistance near $27,500 on the hourly chart of the BTC/USD pair (data feed from Kraken).
- The pair could correct higher, but upsides might be limited above the $27,500 resistance.
Bitcoin Price Drops Again
Bitcoin price failed to start a fresh increase above the $28,000 resistance zone. BTC started a fresh decline and traded below the key $27,500 support zone.
There was a clear move below the $27,400 level and the 100 hourly Simple moving average. The price even dived below the $27,000 level and traded close to the $26,500 support. A low is formed near $26,571 and the price is now consolidating losses.
Bitcoin price is trading below $27,550 and the 100 hourly Simple moving average. There is also a major bearish trend line forming with resistance near $27,500 on the hourly chart of the BTC/USD pair.
Immediate resistance on the upside is near the $26,920 level. It is close to the 50% Fib retracement level of the recent decline from the $27,287 swing high to the $26,571 low. The next major resistance is near the $27,100 level.
The stated resistance is near the 76.4% Fib retracement level of the recent decline from the $27,287 swing high to the $26,571 low. The main resistance is near the $27,500 level.
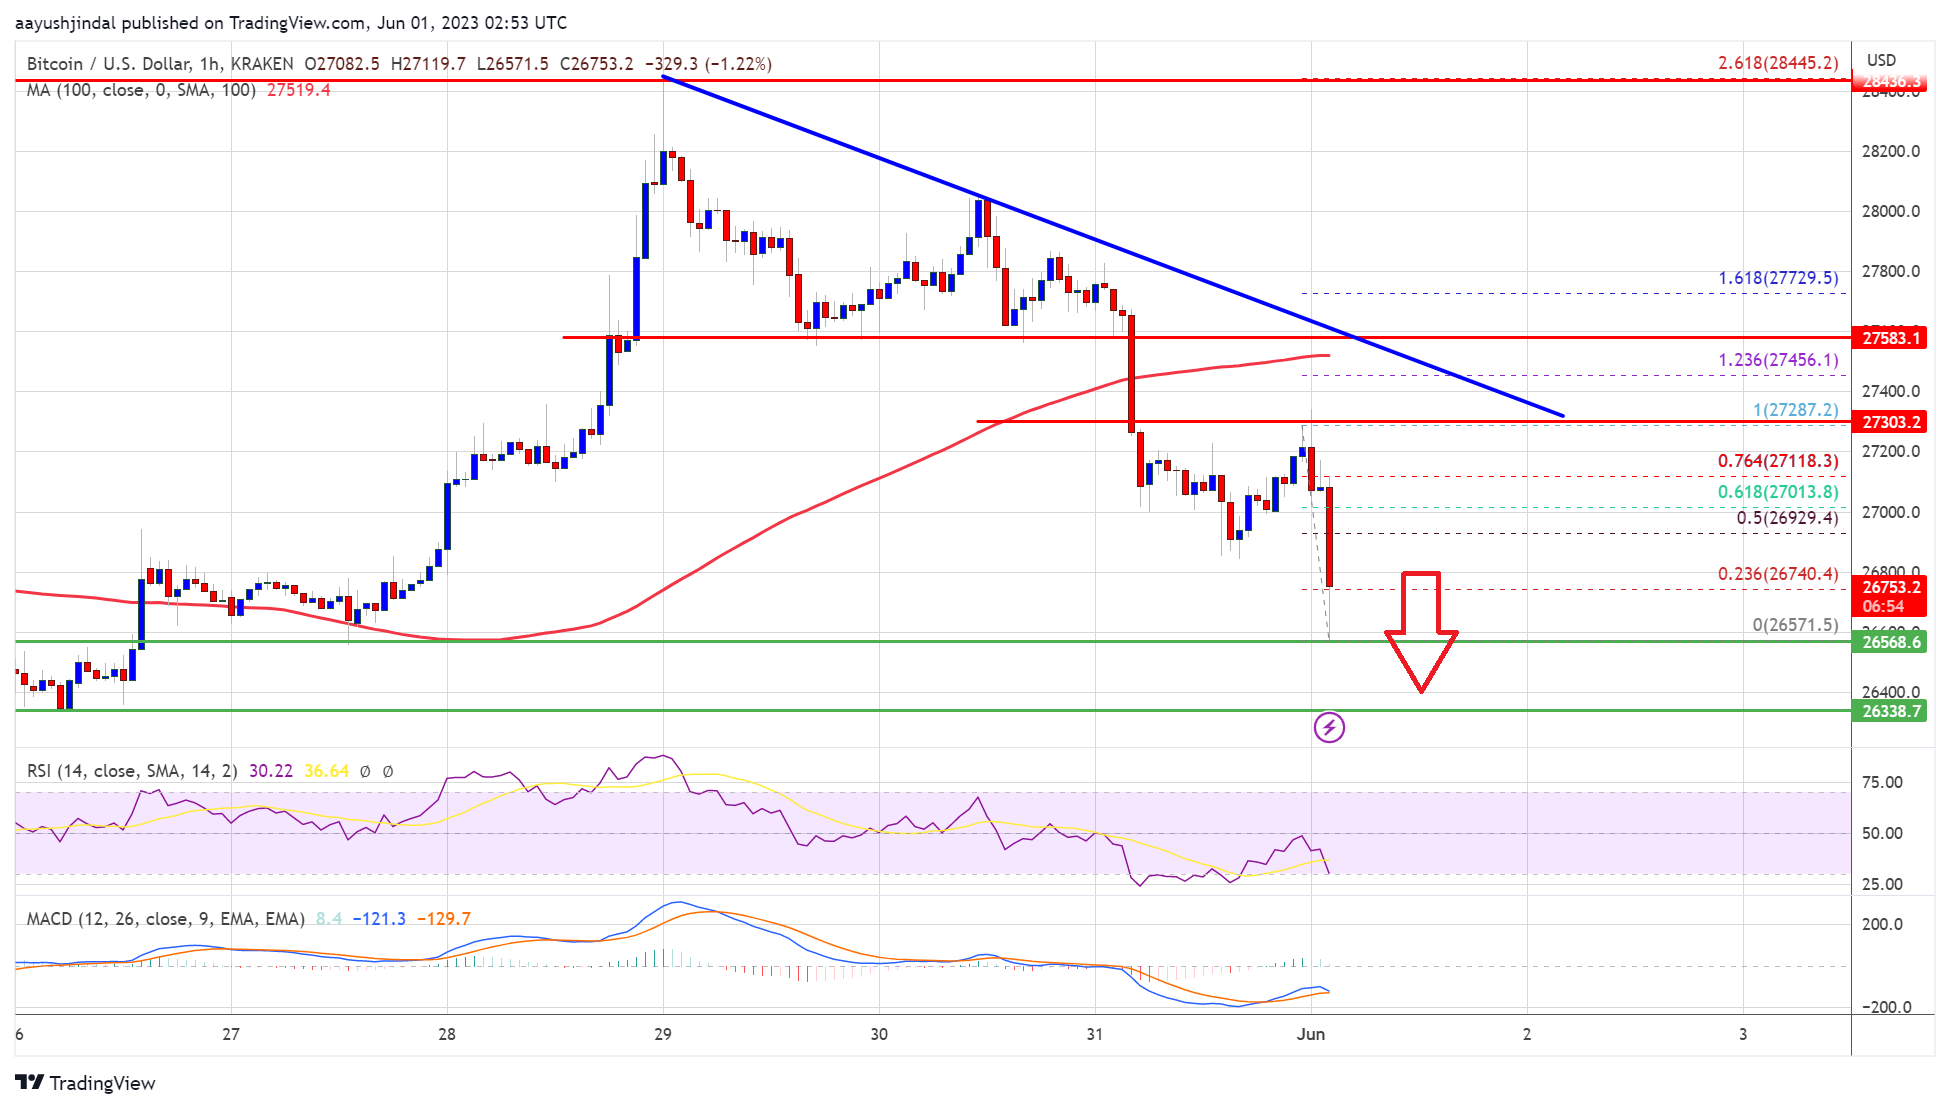
Source: BTCUSD on TradingView.com
An upside break and close above $27,500 could start a steady increase toward $28,000. If the bulls manage to clear the $28,000 resistance zone might send the price toward the $28,500 resistance zone.
More Losses in BTC?
If Bitcoin’s price fails to clear the $27,100 resistance, it could continue to move down. Immediate support on the downside is near the $26,550 level.
The next major support is near the $26,500 zone, below which the price might gain bearish momentum. In the stated case, the price could drop toward the $26,000 support.
Technical indicators:
Hourly MACD – The MACD is now gaining pace in the bearish zone.
Hourly RSI (Relative Strength Index) – The RSI for BTC/USD is below the 50 level.
Major Support Levels – $26,550, followed by $26,500.
Major Resistance Levels – $27,100, $27,400, and $27,500.
- SEO Powered Content & PR Distribution. Get Amplified Today.
- PlatoAiStream. Web3 Data Intelligence. Knowledge Amplified. Access Here.
- Minting the Future w Adryenn Ashley. Access Here.
- Buy and Sell Shares in PRE-IPO Companies with PREIPO®. Access Here.
- Source: https://www.newsbtc.com/analysis/btc/bitcoin-price-takes-hit-26550/
- :is
- 000
- 100
- 50
- 500
- a
- above
- also
- and
- attractive
- average
- BE
- bearish
- Bearish Momentum
- bearish signs
- below
- Bitcoin
- Bitcoin Price
- Break
- BTC
- BTC/USD
- Bulls
- but
- by
- case
- Chart
- clear
- Close
- consolidating
- continue
- correct
- could
- data
- Decline
- down
- downside
- Drop
- Drops
- Even
- Failed
- fails
- followed
- For
- formed
- fresh
- fresh increase
- from
- Gain
- gaining
- High
- higher
- Hit
- HTTPS
- if
- immediate
- in
- Increase
- index
- Indicators
- IT
- Key
- Kraken
- Level
- levels
- Limited
- Line
- losses
- Lot
- Low
- MACD
- Main
- major
- manage
- max-width
- might
- Momentum
- move
- moving
- moving average
- Near
- NewsBTC
- next
- now
- of
- on
- Pace
- pair
- Pivot
- plato
- Plato Data Intelligence
- PlatoData
- price
- recent
- relative strength index
- Resistance
- retracement
- rsi
- Sellers
- send
- Signs
- Simple
- start
- started
- stated
- steady
- strength
- support
- support levels
- Swing
- takes
- The
- There.
- to
- toward
- traded
- Trading
- TradingView
- Trend
- TURN
- Upside
- was
- which
- with
- zephyrnet