Bitcoin is a true modern hero in the financial world as it stands no matter what. Let it be the Chinese government’s ban or US regulators and financial elite’s rejection.
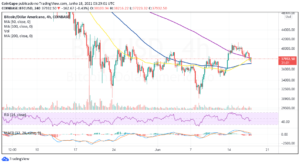
It is amazing how Bitcoin follows a conventional chart structure as it acts like matured instruments over time but at a higher speed. The predicted drop in leg 2 down hasn’t kept us long as it emerged the same day when the previous update was posted.
Most of you thought that this drop could be just a part of a pullback ahead of another Bitcoin rally.

The collapse in red leg 2 down was close to hitting the preset target of $38k, as it bottomed at the $39,600 mark. The structure looks completed as it has met the minimum requirement to travel an equal distance with leg 1.
While the gold is trying to get back on its feet, Bitcoin already has triggered a buy setup when the price broke above the recent top of $45,200 after a consolidation. I drew that setup schematically in the earlier chart within a blue zigzag.
The buy setup is awesome as it is based on the short first move to the upside, making the stop loss distance small though less painful. It has a healthy risk/reward of 1.6 even if the price does not overcome the confirmation level beyond $53k. The minimum target is still at the all-time high, close to $65k, where the risk/reward ratio reaches the great 3.8. When the price breaks above confirmation, moving the stop loss to break even to enjoy the safe ride is better.
Gold did not activate a bullish trigger posted last month as it retested the valley not once, but twice. I thought the metal would ignite the new rally ahead of Bitcoin, as gold was one stage ahead. In the end, it is all about speed.

I spotted a rare pattern in the chart called “Diamond.” First, we observe the bottom type reversal formation. Rising peaks and falling valleys in the left part are connected by a sharp drop “axis” with falling tops and rising bottoms in the right part. The purple trendlines built through extreme points shape a “Diamond.”
The price should break above the right upper side of the pattern around $1,770 to activate a bullish trigger. It nears that point, and at the same time, the RSI indicator approaches the resistance in the sub-chart. The target of the pattern is computed by adding the height of the Diamond to the breakout price. It is located at $1,925. The risk should be limited below the most recent valley inside of the pattern beneath $1,721. The risk-reward ratio stands at a healthy 3.2.
It is amazing to see that the Diamond target is right at the “decision point” of the previous major top of $1,917. Crucial points based on different approaches coincide. We should observe when the price enters that area.
I waited for silver to make another large leg down to retest the $21.67 since last December, but I did not expect it to be so complicated and long-lasting. Unfortunately, the minority of readers, with 38%, supported that idea. So let us see how the silver chart structure has developed since then.
In a December post titled “Could Santa Only Visit Gold?” I shared with you this chart below.

I thought that the joint would shape the second green leg up ahead of another large red leg down. The silver, indeed, followed that plan, although the remaining green part appeared to be more complex as the additional third green leg up has emerged to overcome the major top and hit the $30 area. The declining orange trend channel was invalidated as consolidation’s shape turned flat.
The next chart posted in February shows how the above-mentioned joint developed.

This chart above was one of the options meant to cool down the euphoria in the air when the silver price touched $30. My warning was as follows: “If the price can’t break the former top with a visible margin, then the price could reverse to the downside to build another large leg down to retest the valley of $21.67 established in September 2020”. Hello, $21.43!
The last archived chart below was posted in June, it shows the interim position of the price ahead of a final drop that occurred recently.

Now, after silver has met the minimum requirement of a completed consolidation, we can update the map and the target.

If such would exist, this fresh silver chart above could be a perfect cover for the new edition of a “Silver Bug” magazine. All looks perfect here: the long-lasting consolidation (BC) could be over, the RSI shows a Bullish divergence, the distance to target looks like a space adventure, and the risk/reward at 4.3 is fabulous.
As long as the first visible move to the upside has not emerged yet, one could use the invalidation method to plan the trade. The top of a previous minor consolidation at $24.87 could be considered as a bullish trigger. After activation, consider limiting the risk below the most recent valley beneath the $21.43. The RSI should break up the crucial 50 level to confirm the bullish trigger.
Another option is to wait for the buy setup based on a reversal approach like the one that was triggered in the Bitcoin chart above.
Intelligent trades!
Aibek Burabayev
INO.com Contributor, Metals
Disclosure: This contributor has no positions in any stocks mentioned in this article. This article is the opinion of the contributor themselves. The above is a matter of opinion provided for general information purposes only and is not intended as investment advice. This contributor is not receiving compensation (other than from INO.com) for their opinion.
Source: https://www.ino.com/blog/2021/10/bitcoin-triggered-buy-setup-plus-gold-and-silver/
- "
- 2020
- 67
- Additional
- Adventure
- advice
- All
- AREA
- around
- article
- Ban
- Bitcoin
- Bitcoin Rally
- breakout
- Bug
- build
- Bullish
- buy
- chinese
- Compensation
- consolidation
- day
- DID
- distance
- Drop
- Enters
- Feet
- financial
- First
- fresh
- Futures
- General
- gif
- Gold
- Government
- great
- Green
- here
- High
- How
- HTTPS
- idea
- information
- investment
- IT
- large
- Level
- Limited
- Long
- major
- Making
- map
- mark
- metal
- minority
- move
- Opinion
- Option
- Options
- Other
- Pattern
- price
- rally
- readers
- Regulators
- reverse
- Risk
- safe
- shared
- Short
- Silver
- small
- So
- Space
- speed
- Stage
- Stocks
- Supported
- Target
- the joint
- time
- top
- trade
- travel
- Update
- us
- US Regulators
- wait
- within
- world