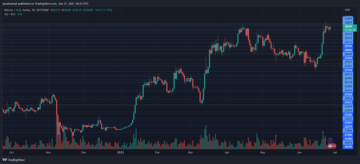
BNB price avoided a major decline below $200 and recovered against the US Dollar. It climbed above $235 and now faces many hurdles near $245 and $250.
- BNB price is slowly moving higher toward the $250 resistance.
- The price is now trading above $235 and the 100 simple moving average (4 hours).
- There is a key bullish trend line forming with support at $241.5 on the 4-hour chart of the BNB/USD pair (data source from Binance).
- The pair might gain bullish momentum if there is a clear move above $250.
BNB Price Recovers 10%
These past few days, BNB price managed to start a recovery wave above the $220 resistance. The recent positive moves in Bitcoin, Ethereum, and other altcoins sparked a decent increase in BNB.
There was a steady move above the $232 and $235 resistance levels. The price even climbed toward the $245 resistance. A high is formed near $245.8 and the price is now consolidating gains. It is trading above the 23.6% Fib retracement level of the upward move from the $222.5 swing low to the $245.8 high.
BNB is also trading above $235 and the 100 simple moving average (4 hours). Besides, there is a key bullish trend line forming with support at $241.5 on the 4-hour chart of the BNB/USD pair.

Source: BNBUSD on TradingView.com
If there is a fresh increase, the price could face resistance near the $245 level. The next resistance sits near the $250 level. A clear move above the $250 zone could send the price further higher. In the stated case, BNB price could test $265. A close above the $265 resistance might set the pace for a larger increase toward the $280 resistance.
Downside Correction?
If BNB fails to clear the $245 resistance, it could start a downside correction. Initial support on the downside is near the $240 level and the trend line.
The next major support is near the $235 level or 50% Fib retracement level of the upward move from the $222.5 swing low to the $245.8 high. If there is a downside break below the $235 support, the price could drop toward the $226 support. Any more losses could initiate a larger decline toward the $220 level.
Technical Indicators
4-Hours MACD – The MACD for BNB/USD is losing pace in the bullish zone.
4-Hours RSI (Relative Strength Index) – The RSI for BNB/USD is currently above the 50 level.
Major Support Levels – $240, $235, and $226.
Major Resistance Levels – $245, $250, and $265.
- SEO Powered Content & PR Distribution. Get Amplified Today.
- PlatoData.Network Vertical Generative Ai. Empower Yourself. Access Here.
- PlatoAiStream. Web3 Intelligence. Knowledge Amplified. Access Here.
- PlatoESG. Carbon, CleanTech, Energy, Environment, Solar, Waste Management. Access Here.
- PlatoHealth. Biotech and Clinical Trials Intelligence. Access Here.
- Source: https://www.newsbtc.com/analysis/bnb/bnb-price-shows-signs-of-life-250/
- :is
- 1
- 100
- 23
- 50
- 8
- a
- above
- against
- also
- Altcoins
- and
- any
- At
- average
- avoided
- below
- besides
- binance
- bnb
- BNB Price
- BNB/USD
- Break
- Bullish
- but
- case
- Chart
- clear
- Climbed
- Close
- consolidating
- could
- Currently
- data
- Days
- Decline
- Dollar
- downside
- Drop
- Even
- Face
- faces
- fails
- few
- For
- formed
- fresh
- fresh increase
- from
- further
- Gain
- Gains
- High
- higher
- HOURS
- HTTPS
- Hurdles
- if
- in
- Increase
- index
- initial
- initiate
- IT
- Key
- larger
- Level
- levels
- Life
- Line
- losing
- losses
- Low
- MACD
- major
- managed
- many
- max-width
- might
- Momentum
- more
- move
- moves
- moving
- moving average
- Near
- NewsBTC
- next
- now
- of
- on
- or
- Other
- Pace
- pair
- past
- plato
- Plato Data Intelligence
- PlatoData
- positive
- price
- recent
- Recovers
- recovery
- relative
- relative strength index
- Resistance
- retracement
- rsi
- send
- set
- Shows
- Signs
- Simple
- sits
- Slowly
- Source
- sparked
- start
- stated
- steady
- strength
- support
- support levels
- Swing
- test
- The
- There.
- to
- toward
- Trading
- TradingView
- Trend
- upward
- us
- US Dollar
- was
- Wave
- with
- zephyrnet