A look at on-chain analysis for Bitcoin (BTC) and Ethereum (ETH), more specifically the market and realized capitalization levels.
Despite the decrease in market cap, the realized cap for both ETH and BTC reached new all-time highs on Aug 28.
Market and realized cap
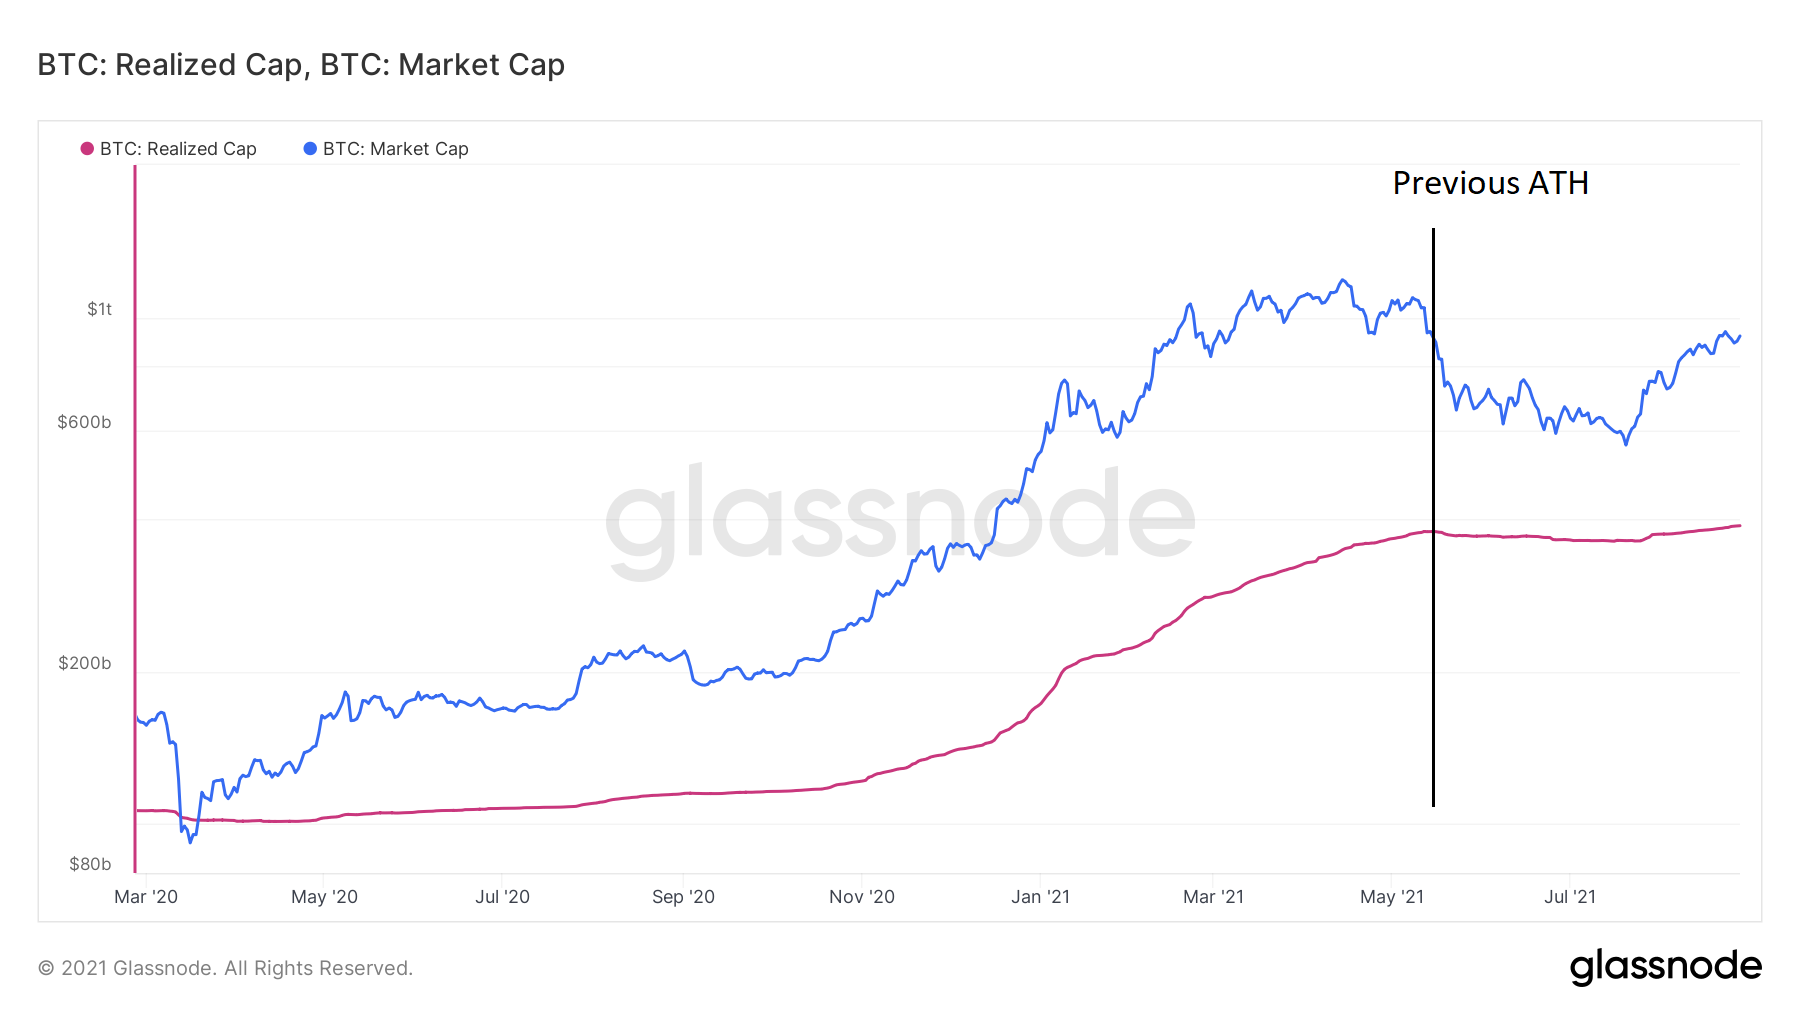
In order to create the market cap (MC), the current BTC price is multiplied with the total number of coins that are mined so far.
The realized cap (RC) also uses the total number of coins that are mined, but multiplies them with the price during the time they last moved instead of the current one. This is done in order to devalue lost coins are those that have not moved for a long time.
The market is in profit if MC > RC, while it is in loss if the opposite is true.
BTC
In bull markets, RC increases considerably, since old coins are spent in order to book profits. Conversely, it decreases in bear markets, when holders sell at a loss.
Despite the considerable drop from the all-time high price in April, RC actually reached a new all-time high of $378 Billion on May 17. After a slight drop, a new all-time high of $387 Billion was reached on Aug. 28.

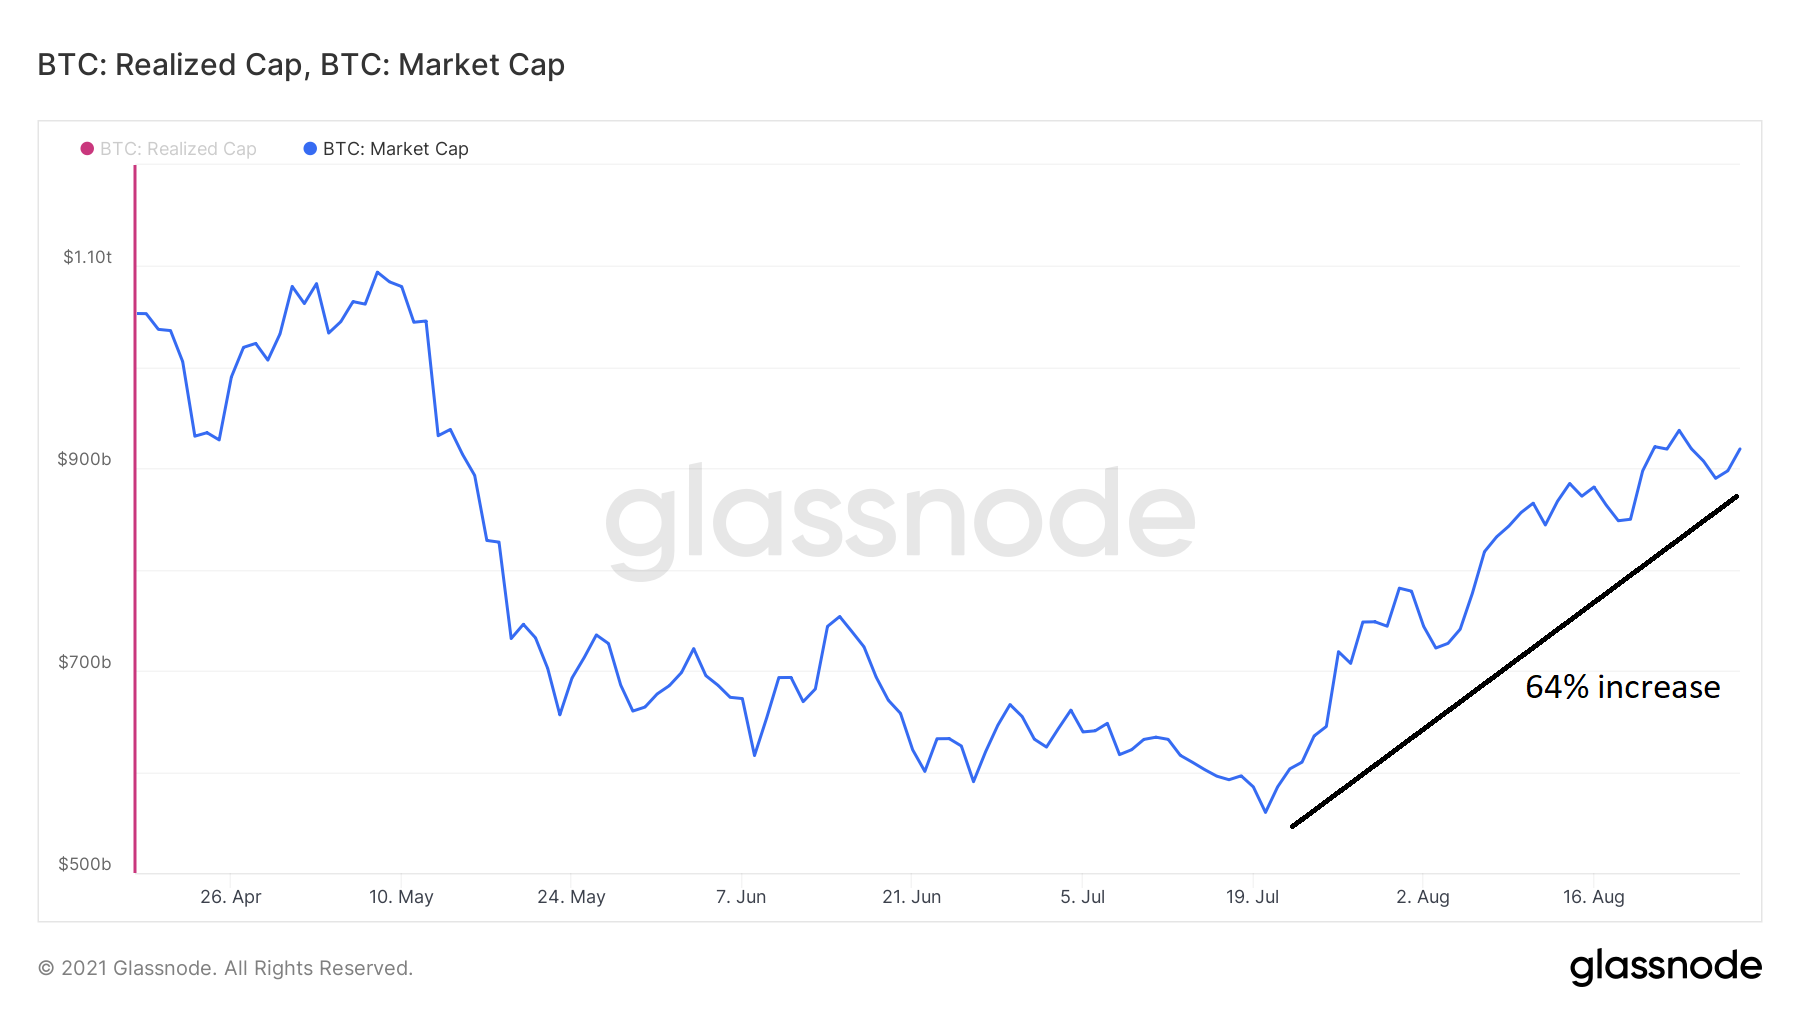
An interesting development is the fact that RC has not increased that much compared to MC when looking at it from the most recent BTC low on July 20. During this period, RC has increased by 7%.
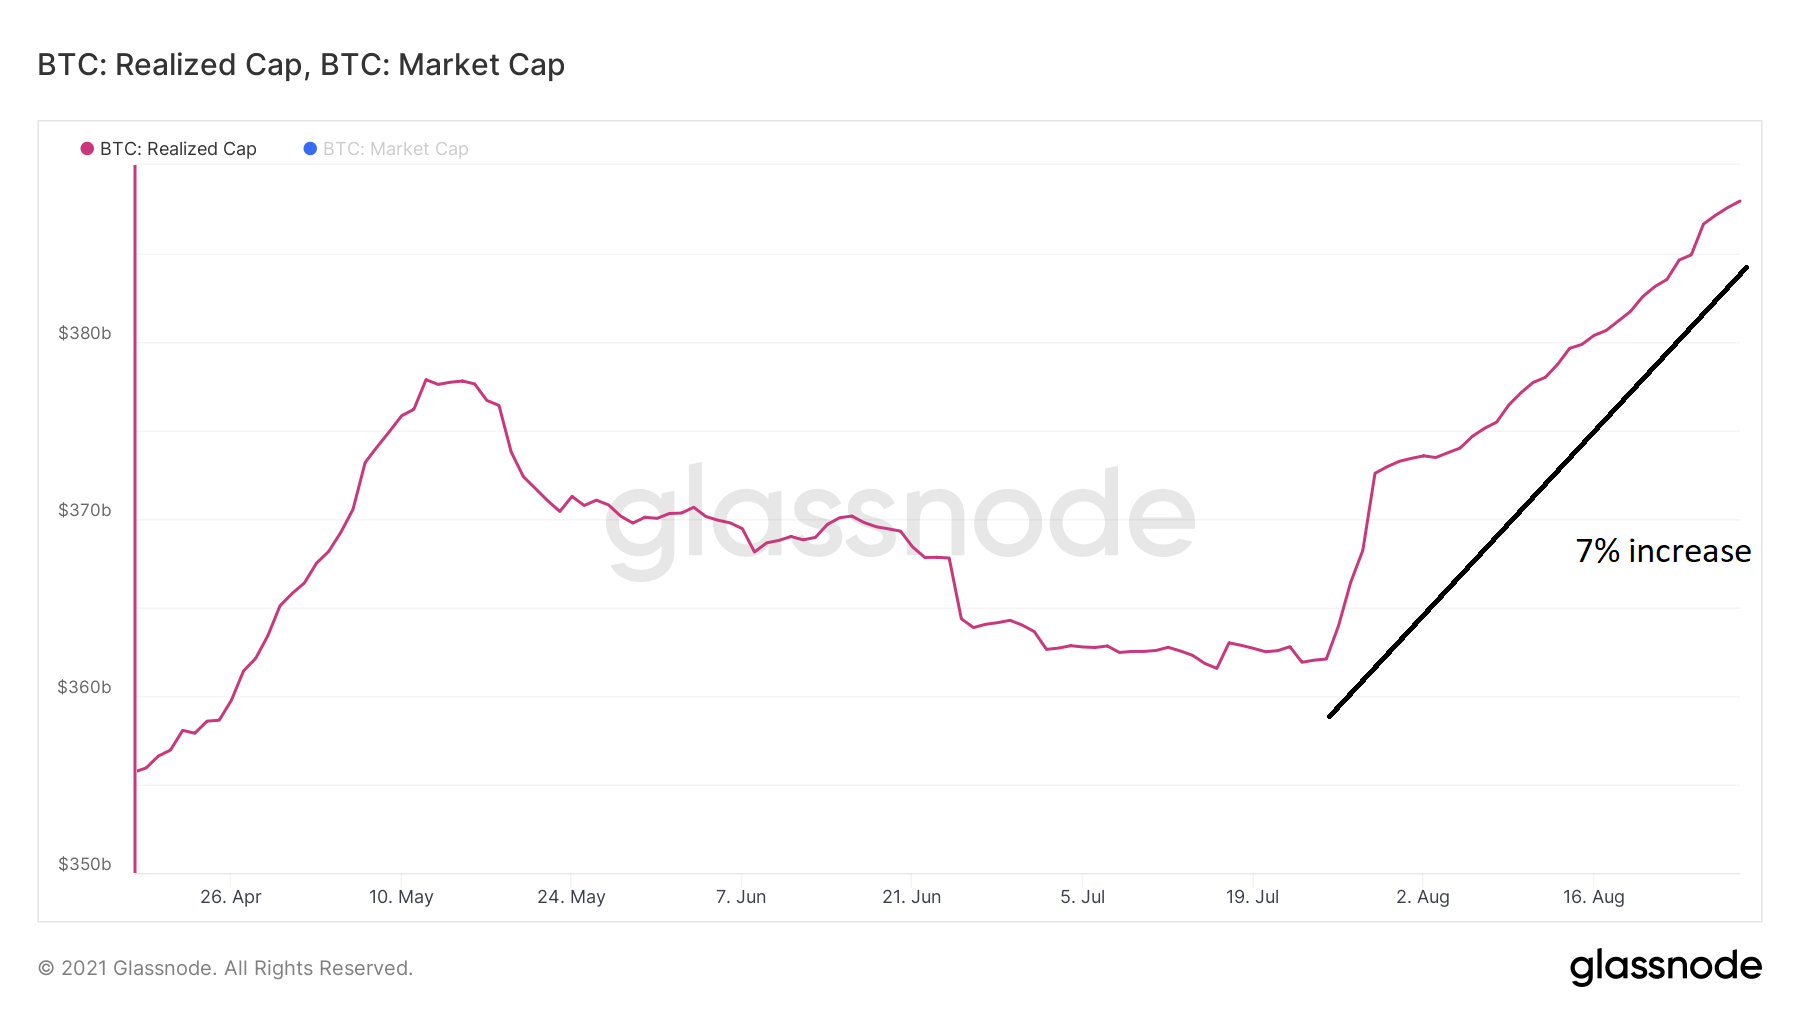
On the other hand, MC has increased by a full 64%. This means that while the BTC price has been increasing, coins that last moved at lower prices are not on the move.
This could mean one of two things:
The first is that holders have previously taken profit and are now remaining out of the markets. The second is that they are still holding without taking considerable profit during the ongoing rally. What is clear is that participants are not selling at a loss, since there is no decrease in RC.
Our previous analysis noted that there have been some old coins on the move, especially on Aug. 17. However, the lack of a considerable increase in RC suggests that the selling is not significant when compared to the total number of coins.
ETH
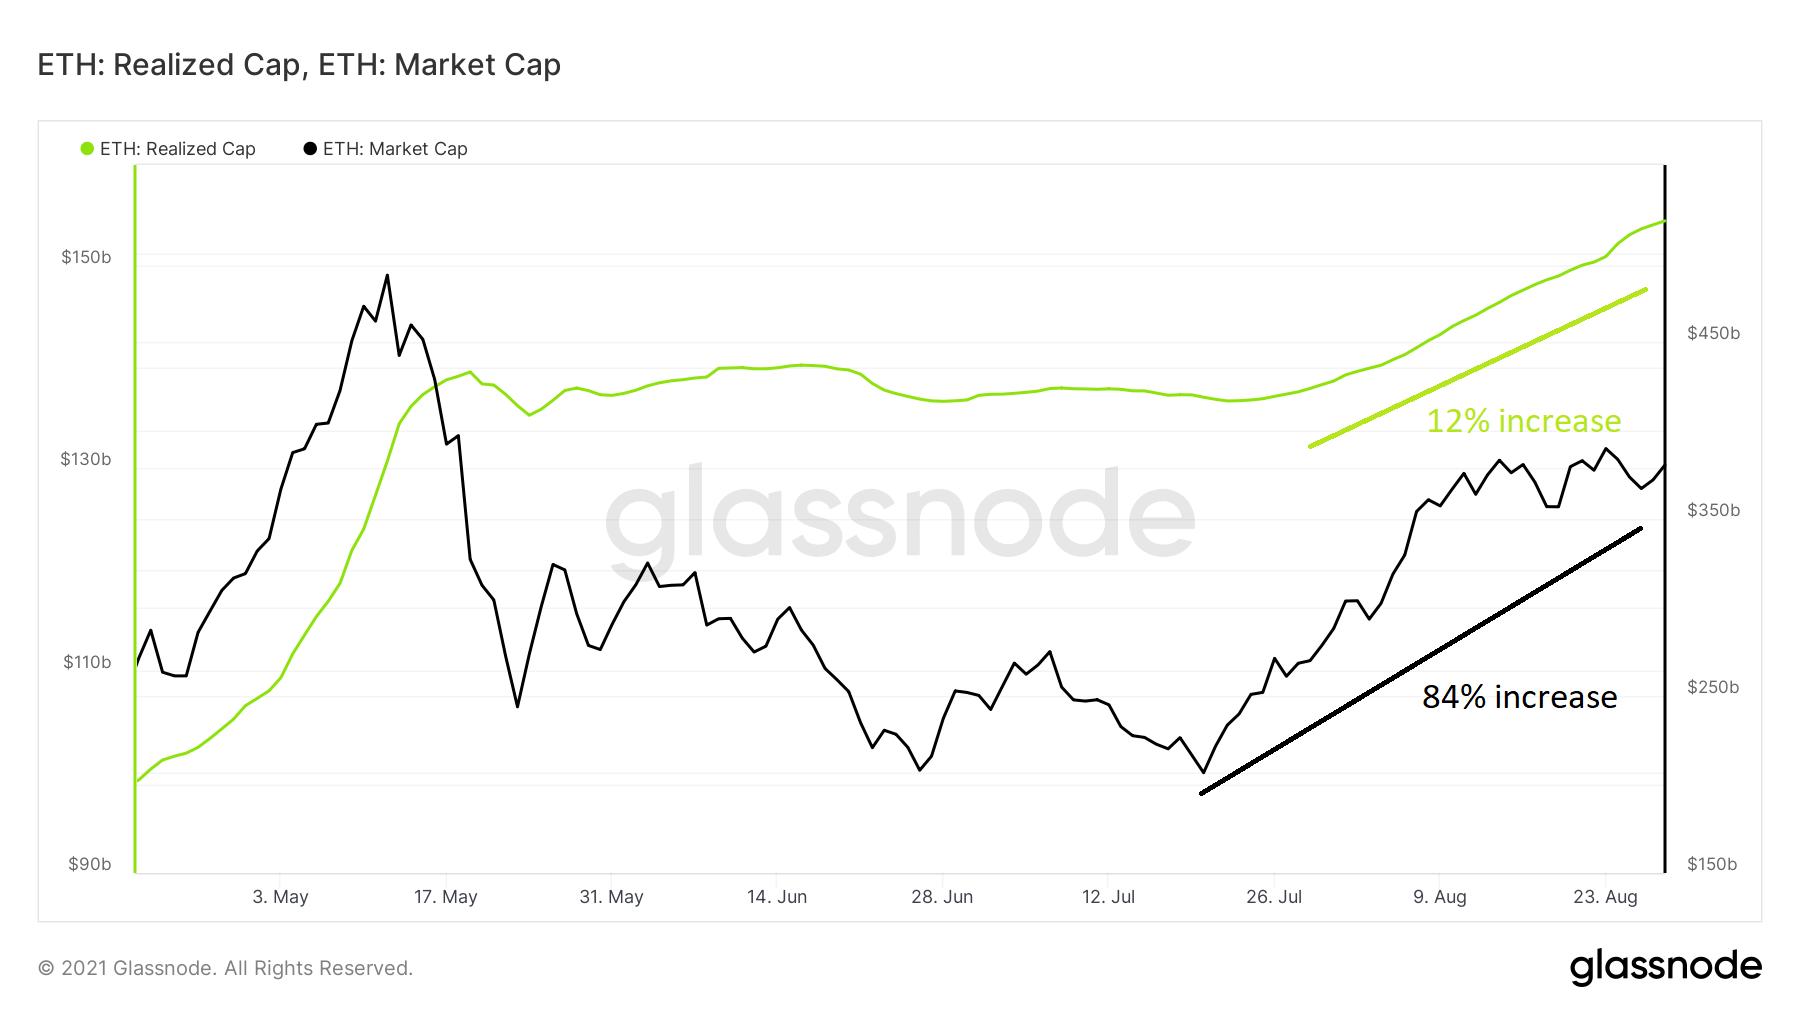
The movement in both MC and RC for ETH is very similar to that of BTC. RC initially reached an all-time high on May 19, only seven days after MC did the same.
After a slight drop, it continued to increase and reached a new all-time high of $154 Billion on Aug. 28.
However, when looking at the movement since July 20, MC has increased by 84%, while RC has only done so by 12%
Therefore, similarly to BTC, MC has increased at a much faster than RC in the case of ETH.
For BeInCrypto’s latest Bitcoin (BTC) analysis, click here.
Disclaimer
All the information contained on our website is published in good faith and for general information purposes only. Any action the reader takes upon the information found on our website is strictly at their own risk.
- Action
- All
- analysis
- analyst
- April
- barcelona
- Billion
- BTC
- btc price
- capitalization
- Coins
- cryptocurrencies
- cryptocurrency
- Current
- data
- Development
- DID
- discovered
- Drop
- Economics
- ETH
- financial
- First
- full
- General
- Glassnode
- good
- graduate
- High
- HTTPS
- Increase
- information
- IT
- July
- Long
- Market
- Market Cap
- Markets
- move
- order
- Other
- price
- Profit
- rally
- Reader
- Risk
- School
- sell
- So
- time
- Website
- websites
- What is
- writing