Published 3 hours ago
BTC Price Prediction: After three weeks of the consolidation phase, the Bitcoin price breached a local resistance of $28800, signaling the resumption of a bullish recovery. Thus, the BTC price has surged 8.5% in the last five days and reached the $30000 mark for the first time in 10 months. Here’s how you can trade this breakout to grab a potential recovery opportunity.
advertisement
Key Points
- A potential pullback could plunge the Bitcoin price by 4-5% to recuperate the bullish momentum of $29000 support.
- The Bitcoin Fear & Greed Index at 61 reflects the market sentiment supporting the resumption of prevailing recovery.
- The intraday trading volume in Bitcoin is $18.5 Billion, indicating a 0.15% loss
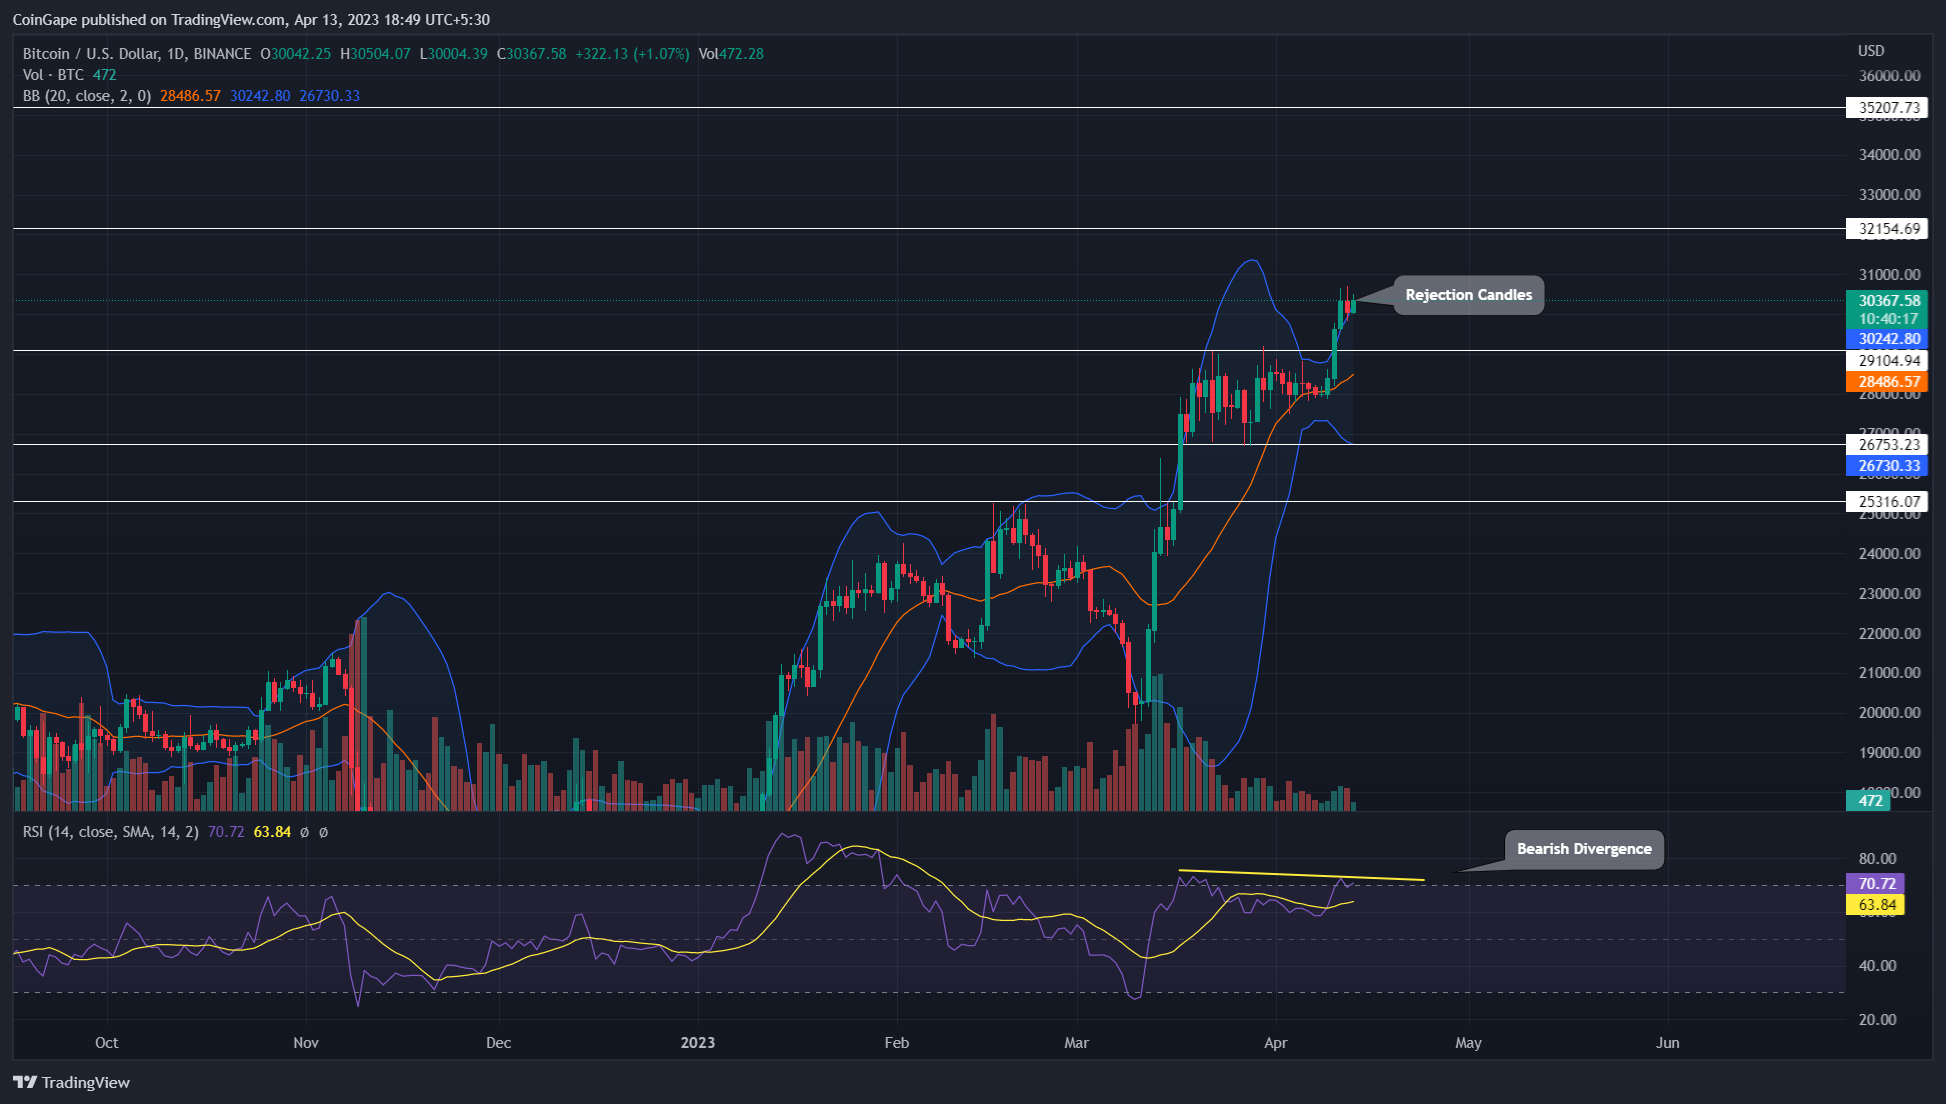
Source-Tradingview
On April 10th, the Bitcoin price breakout from the combined resistance of $28800 and 0.238 Fibonacci retracement level offered buyers a significant launchpad to prolong the bullish recovery. As of now, the Bitcoin price trades at the $30302 mark with an intraday gain of 0.84%.
The daily chart showcasing a higher wick rejection near $30000 indicates the traders are booking early profit at the psychological resistance. These rejection signs could trigger a temporary pullback and tumble prices 4-5% down to retest flipped support of $29000-$28800.
Trending Stories
If the prices manage to sustain above the aforementioned support, interested traders can look for an entry opportunity to go long. With sustained buying the Bitcoin price is likely to be $32150, followed by $35200.
Concisely, a daily candle closing below $28800 could tumble the prices back to the $26750 mark.
Technical Indicator
RSI: The daily RSI slope struggling to surpass its last swing high indicates weakness in bullish momentum and a higher possibility for an aforementioned retest.
Bollinger Band: the midline of the Bollinger Band indicator can act as dynamic support carrying the ongoing recovery.
Bitcoin Price Intraday Levels
- Spot rate: $30458
- Trend: Bullish
- Volatility: Medium
- Resistance levels- $32150 and $35200
- Support levels- $28800 and $26750
Share this article on:
advertisement
The presented content may include the personal opinion of the author and is subject to market condition. Do your market research before investing in cryptocurrencies. The author or the publication does not hold any responsibility for your personal financial loss.
<!– Close Story–>
- SEO Powered Content & PR Distribution. Get Amplified Today.
- Platoblockchain. Web3 Metaverse Intelligence. Knowledge Amplified. Access Here.
- Source: https://coingape.com/markets/btc-price-prediction-bitcoin-price-hints-4-5-pullback-before-bull-run-continues/
- :is
- 1
- 10
- 15%
- 7
- 8
- 9
- a
- above
- Act
- Ad
- and
- April
- ARE
- article
- AS
- At
- author
- avatar
- back
- BAND
- banner
- BE
- Beauty
- before
- below
- Billion
- Bitcoin
- Bitcoin News
- Bitcoin Price
- blockchain
- booking
- breakout
- Brian
- BTC
- btc price
- BTC price prediction
- bull
- Bull Run
- Bullish
- buyers
- Buying
- by
- CAN
- carrying
- Chart
- closing
- Coingape
- COM
- combined
- condition
- consolidation
- content
- continues
- could
- crypto
- cryptocurrencies
- cryptocurrency
- daily
- Days
- different
- down
- dynamic
- Early
- Entertainment
- entry
- Ether (ETH)
- Fashion
- fear
- Fear & Greed
- Fear & Greed Index
- finance
- financial
- First
- first time
- follow
- followed
- For
- from
- Gain
- Go
- grab
- Greed
- Have
- High
- higher
- hints
- hold
- HOURS
- How
- HTTPS
- i
- in
- include
- Including
- index
- indicates
- interested
- investing
- ITS
- journalism
- jpg
- Last
- Launchpad
- likely
- local
- Long
- Look
- loss
- manage
- mark
- Market
- market research
- market sentiment
- May..
- Momentum
- months
- Near
- news
- of
- offered
- on
- ongoing
- Opinion
- Opportunity
- past
- personal
- phase
- plato
- Plato Data Intelligence
- PlatoData
- plugin
- plunge
- possibility
- potential
- potential recovery
- prediction
- presented
- price
- Price Prediction
- Prices
- Profit
- Publication
- pullback
- Rate
- reached
- Read
- recovery
- reflects
- research
- Resistance
- responsibility
- retracement
- Run
- sentiment
- Share
- showcasing
- significant
- Signs
- Struggling
- subject
- support
- Supporting
- Surged
- surpass
- sustained
- Swing
- temporary
- The
- These
- three
- time
- to
- Topics
- trade
- Traders
- trades
- Trading
- trading volume
- TradingView
- trending
- trigger
- variety
- volume
- weakness
- Weeks
- with
- Work
- working
- written
- years
- Your
- zephyrnet