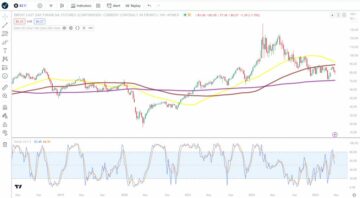
- Significant up move in G-20 2-year sovereign bond yields except for Japan & China.
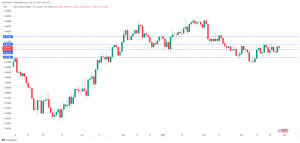
- US 2-year Treasury yield may eye the next immediate resistance at 5.20%.
- Higher cost of funding in H2 may deflate current optimism in US stocks.
- Japan’s finance officials have ratcheted up verbal intervention to talk down USD/JPY strength.
Welcome to June month-end, Q2 2023-end, and H1 2023-end where three different periods of closing coincide at the same time which tends to lead to higher volatility in certain asset classes due to a confluence of activities among market participants, portfolio’s rebalancing, and window-dressing.
The moments of “higher volatility” have been captured in the bond market this time around as global sovereign bond yields among the G-20 nations (except for Japan & China) have spiked up significantly yesterday, 29 June; bond yields increase led to bond prices decrease.
Global 2-YR sovereign bond yields on an uptrend exception for Japan & China
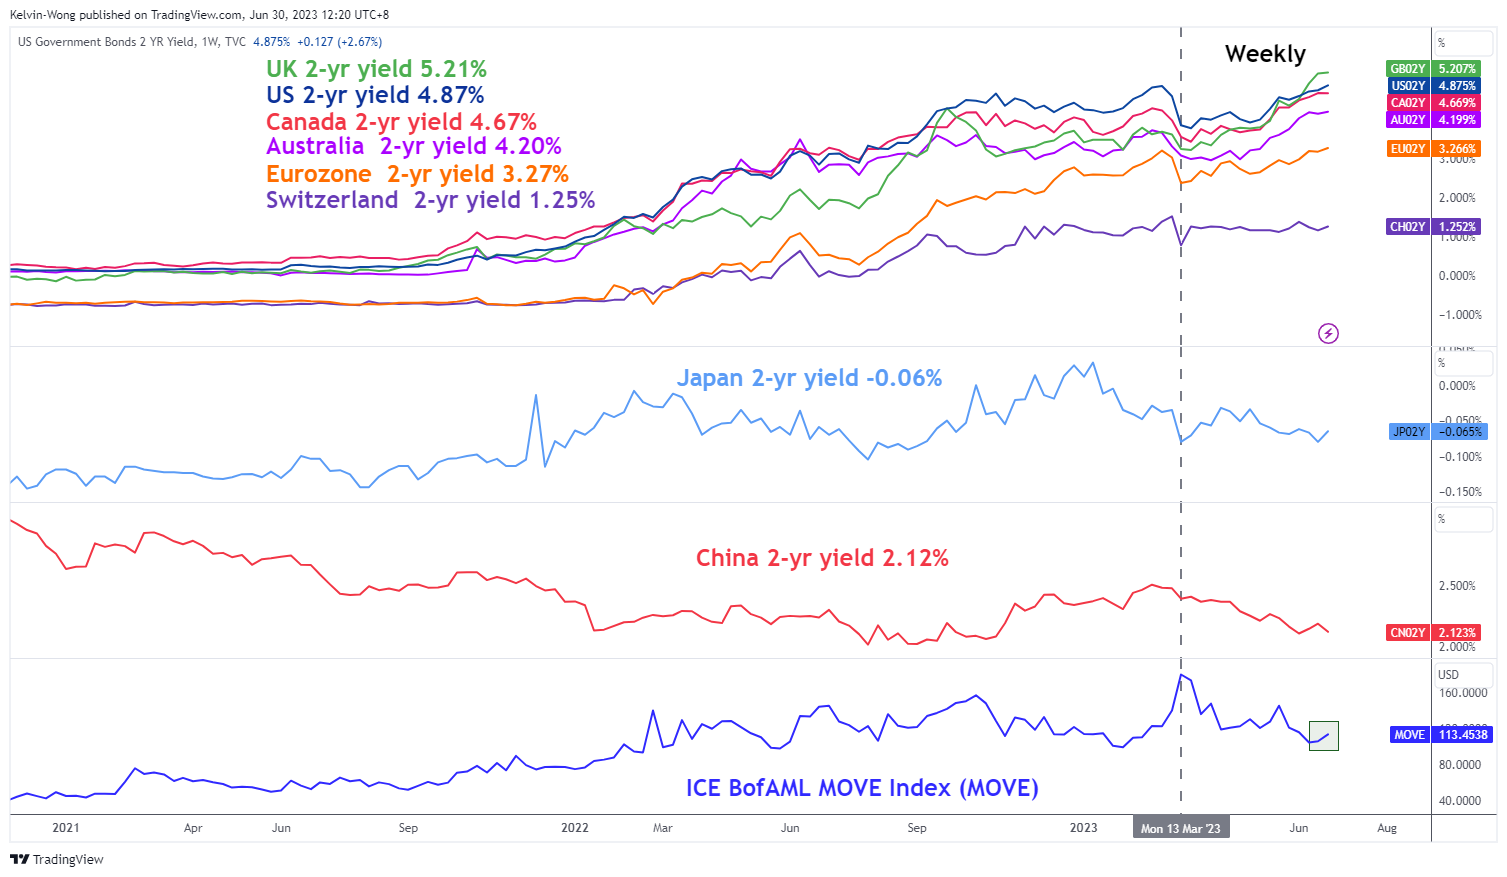
Fig 1: G-20 2-YR sovereign yields medium-term trend with MOVE Index as of 30 Jun 2023 (Source: TradingView, click to enlarge chart)
Even the implied volatility of bond yields that measures the future movement of volatility has jumped up as well, the ICE BofAML MOVE Index, a gauge that measures the implied volatility of the US Treasury markets via options recorded a daily gain of +4.8% to close at 113.45 yesterday and hit its highest level since 20 June 2023.
Technical analysis suggests further potential up move trajectories in US Treasury yields
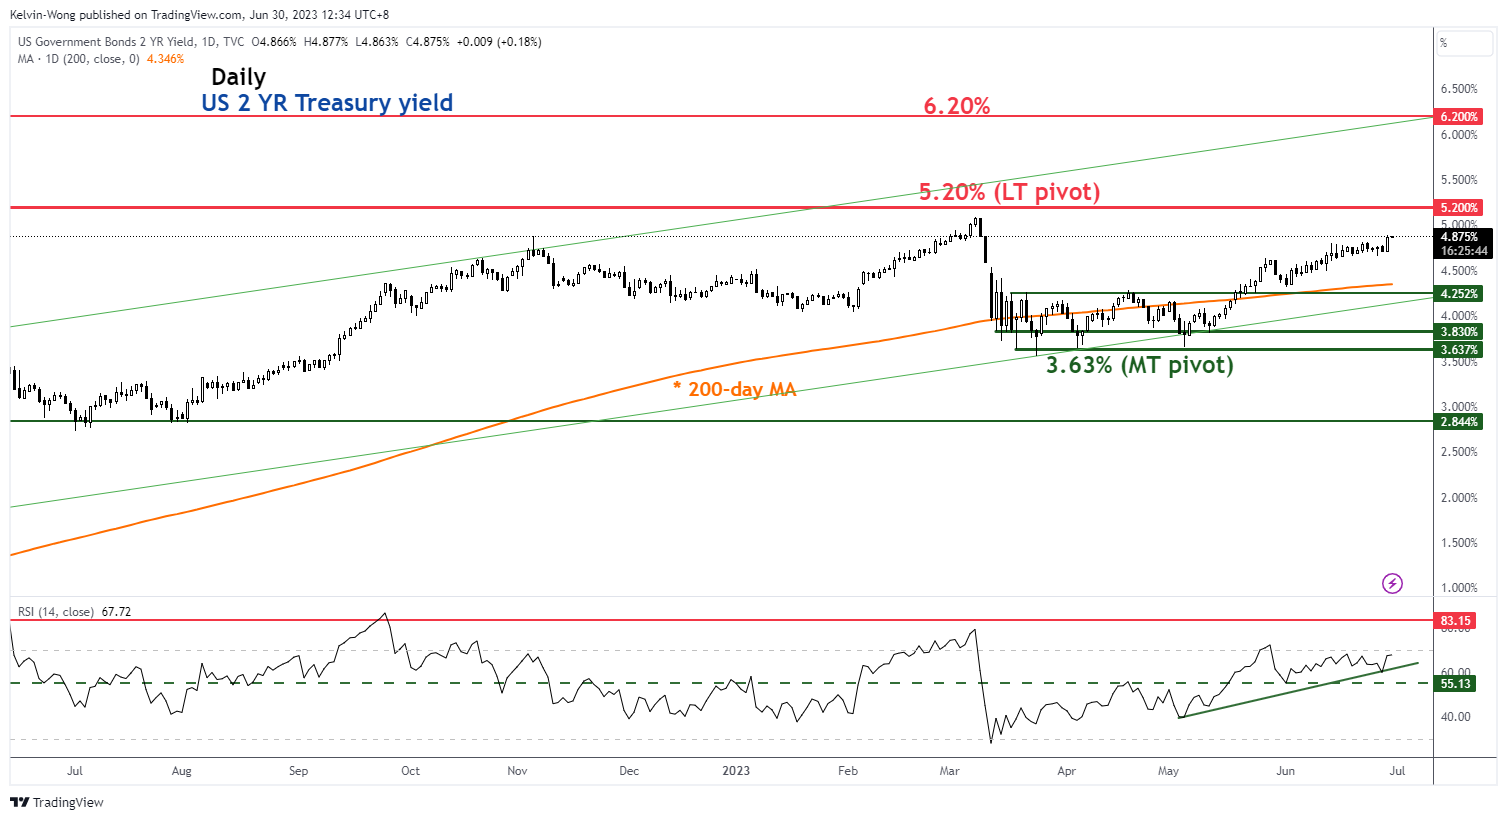
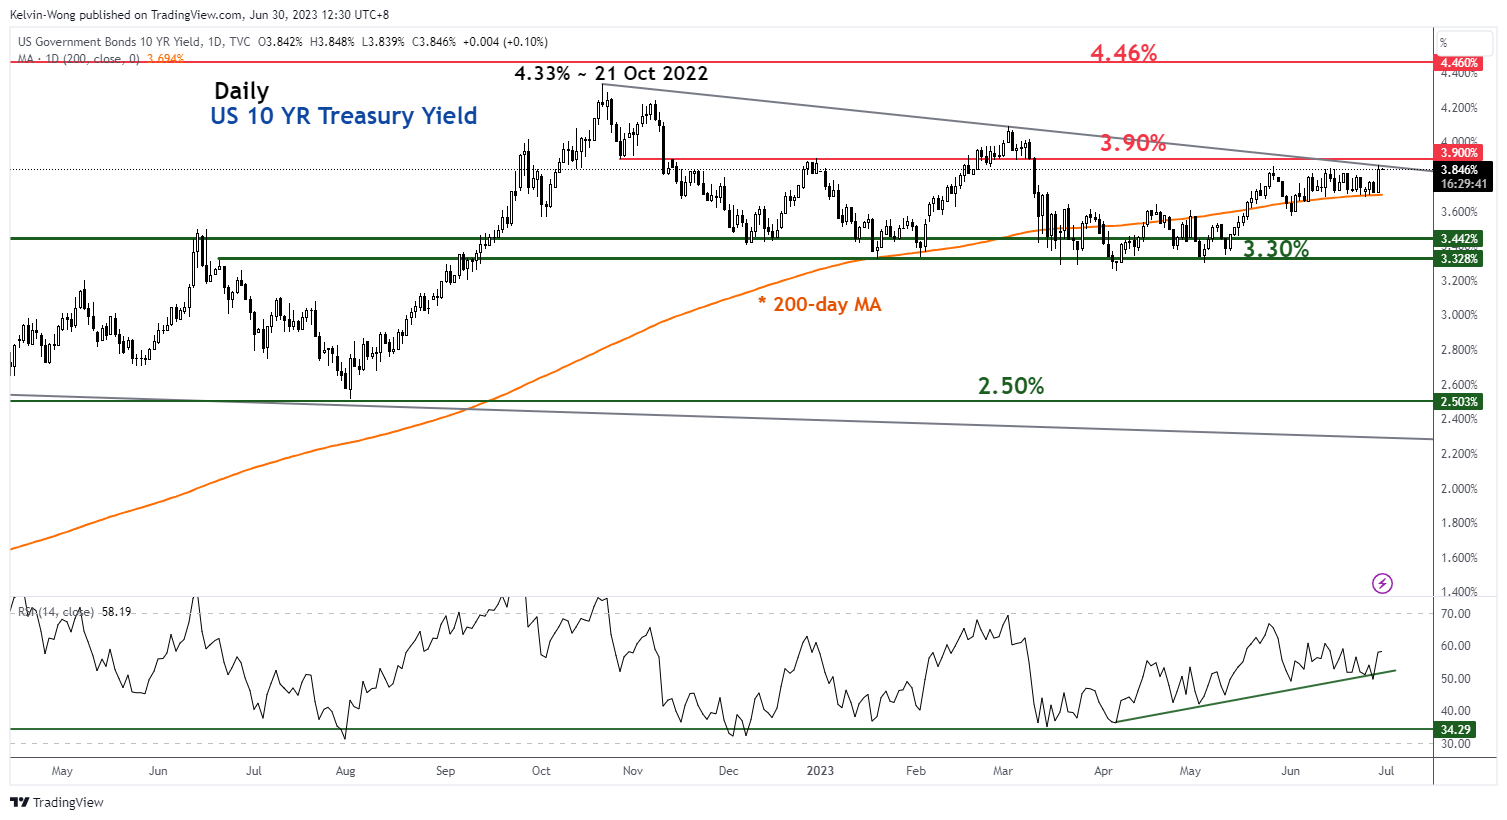
Fig 2: 10-YR & 10-YR US Treasury yield medium-term trends as of 30 Jun 2023 (Source: TradingView, click to enlarge chart)
The 2-year Treasury yield jumped by +15 basis points (bps) yesterday, the highest single-day gain since 25 May 2023 and it is now eying a key resistance at 5.20%. A clearance above it sees the next resistance coming in at 6.20% (the upper limit of a major ascending channel in place since the 1 March 2022 low).
The longer-term 10-year Treasury yield gained (+13 bps yesterday) as well but at a slower momentum pace versus the 2-year yield. Right now, it is approaching key intermediate resistance at 3.90% which has capped prior bullish movements since the 21 October 2022 high of 4.33%. A clearance above 3.90% sees the next resistance coming in at 4.46%.
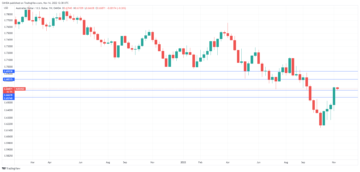
Deeper yield curve inversion & tighter financial conditions may deflate optimism in US stocks
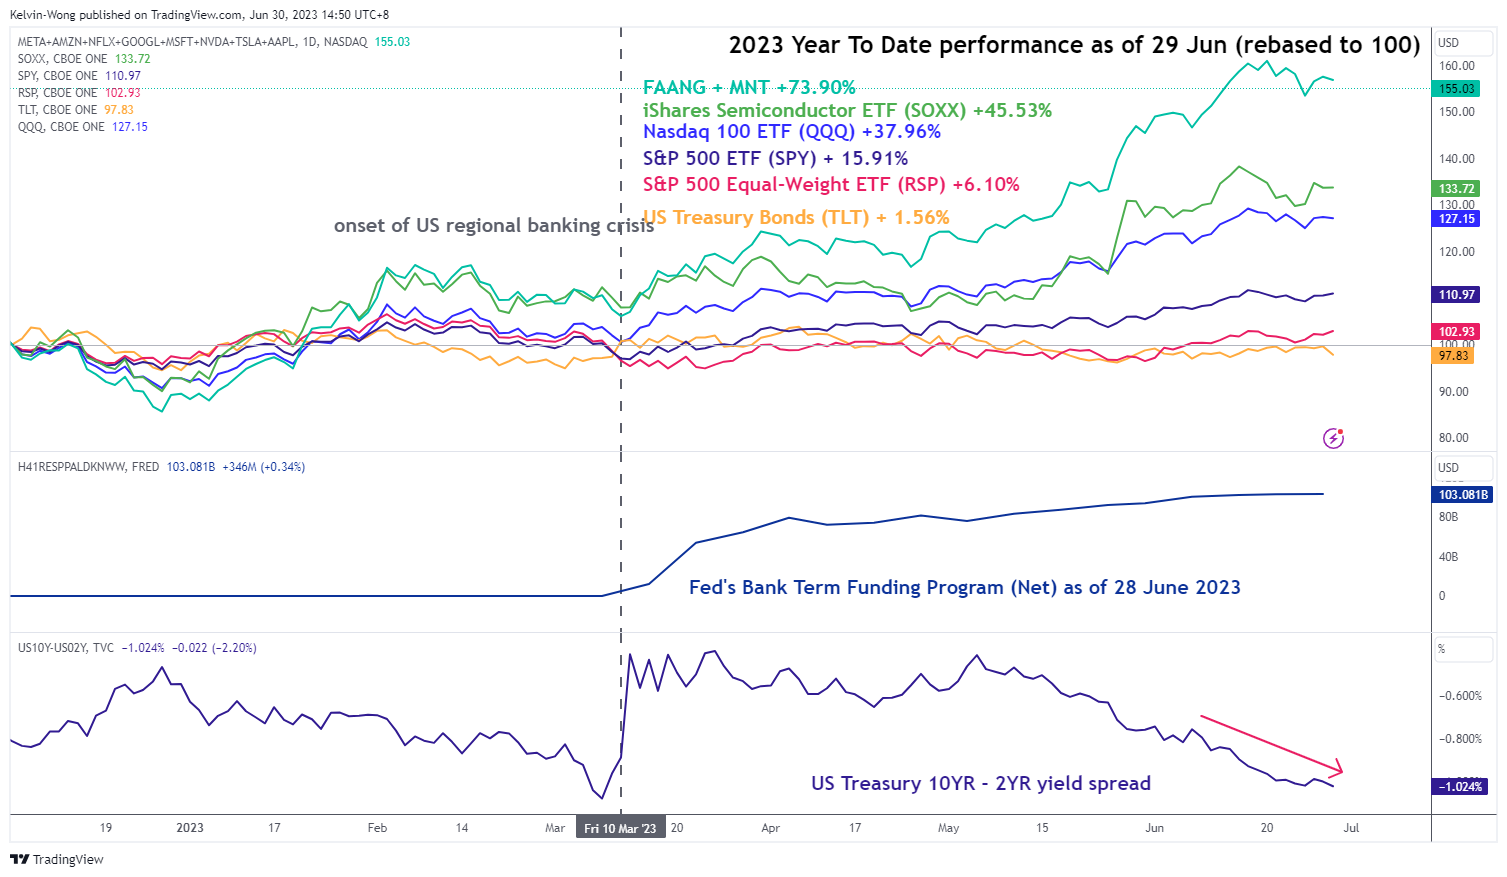
Fig 3: US key benchmark stock indices year-to-date performance with US Treasury 10-YR-2-YR yield spread as of 29 Jun 2023 (Source: TradingView, click to enlarge chart)
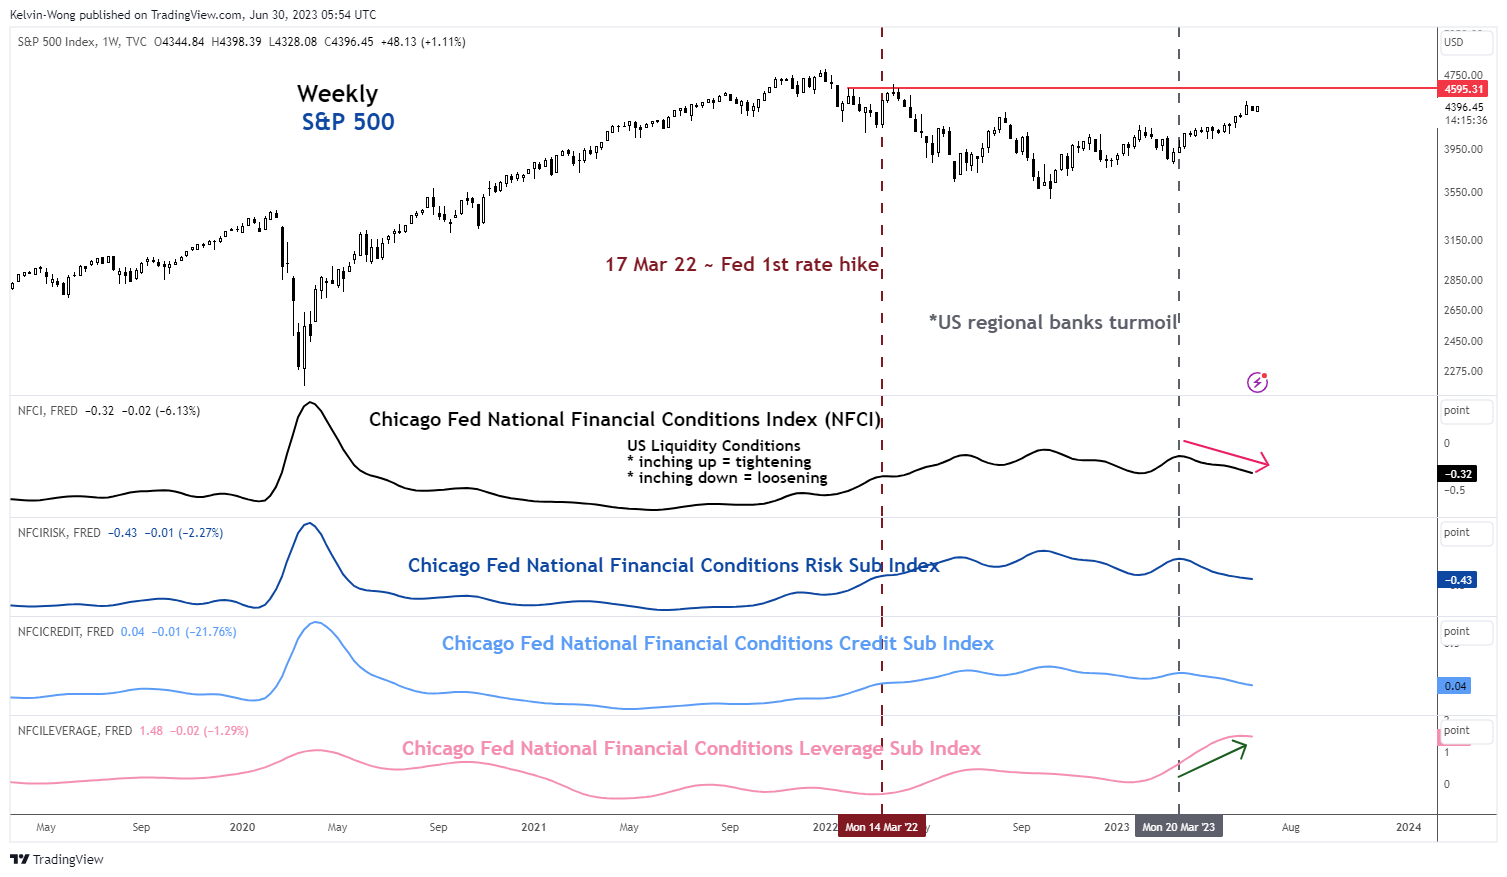
Fig 4: US S&P 500 major trend with Chicago Fed’s Financial Conditions Index as of 29 Jun 2023 (Source: TradingView, click to enlarge chart)
The US Nasdaq 100 has been the global outperformer in the first half of 2023 thanks to the stellar performances of the mega-cap technology stocks that rode on the emergence of the “high productivity optimism” wave driven by Artificial Intelligence (AI) technologies.
The six-month performance of the Nasdaq 100 as of 29 June 2023 stood at +36.57%, its best performance since the second half of 1999 before the Dot.com bubble burst.
The upbeat tone of the Nasdaq 100 has been supported by a looser financial condition in the US after the US regional banking turmoil in March, partly assisted by a liquidity backstop, the Fed’s Bank Term Funding Programme that has continued to increase but at a slower pace since early June 2023.
Meanwhile, the 10-year over 2-year US Treasury yield spread has continued its inversion path to -1.02%, its lowest level since early March 2023 which has signalled an increase odd of further economic weakness in H2.
The Chicago Fed’s National Financial Condition Index (NFCI) has been on a downward path since the US regional banking turmoil subsided in early April 2023 which indicates a loosening of financial/liquidity conditions in the US. Based on the latest data for the week ending 23 June, the composite NFCI ticked down further to -0.32.
However, the trend of its leading Leverage sub-component has remained upward since mid-March 2023, and if the US Treasury yields continued their expected upward trajectories, it may lead to an increase in funding costs which could see upside pressure on the Leverage sub-component. Thus, a series of future upticks in the composite NCFI that indicates a tighter financial condition cannot be ruled out.
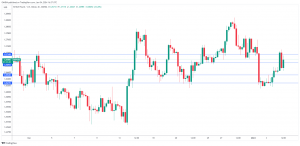
USD/JPY rally is coming closer to the key resistance zone of 145.50/146.10 with risk of intervention
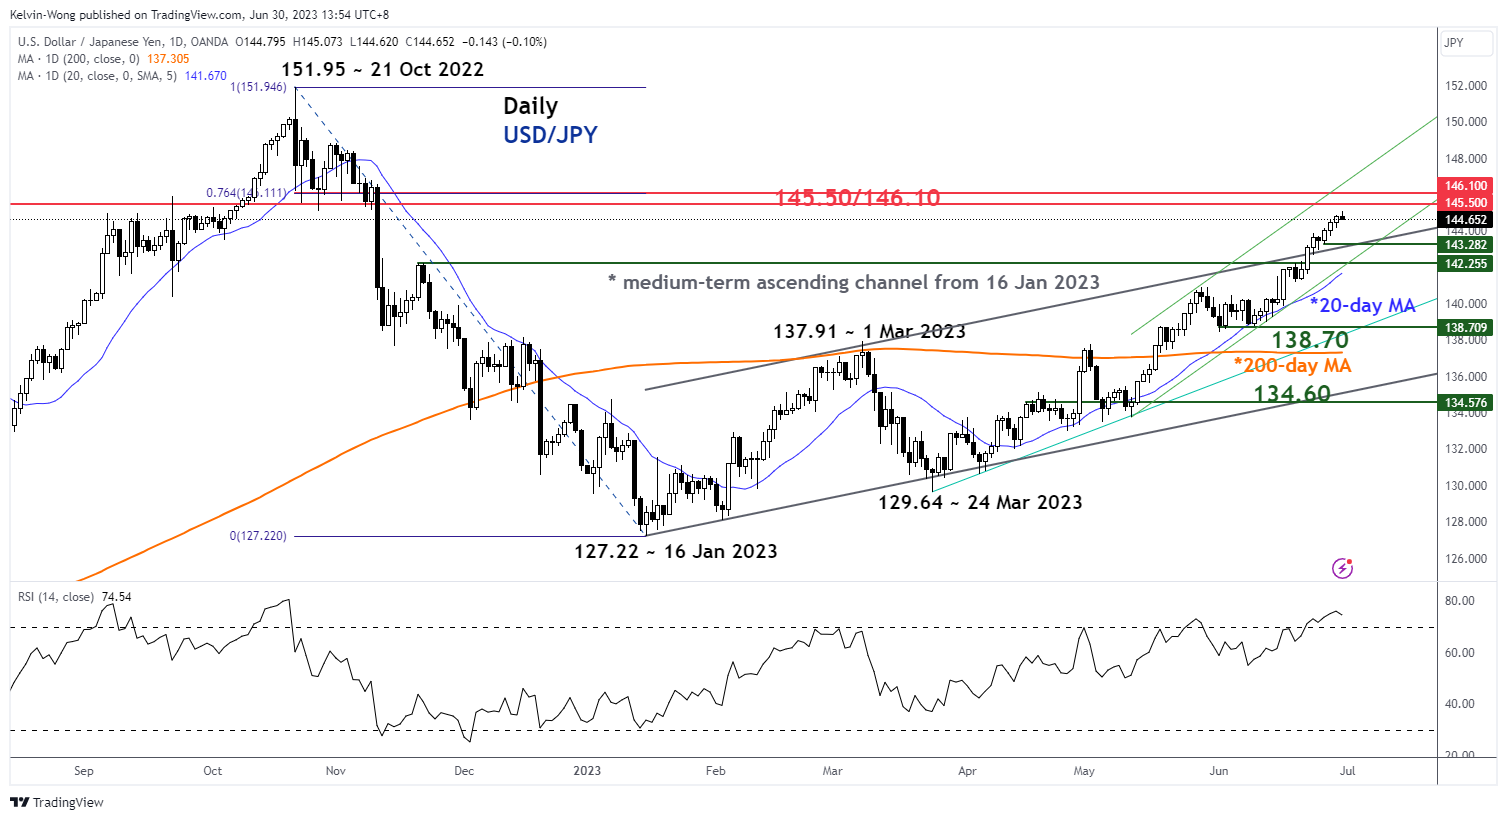
Fig 5: USD/JPY medium-term trend as of 30 Jun 2023 (Source: TradingView, click to enlarge chart)
The bulls of USD/JPY have started to get a bit cautious of the recent four-week weakness seen in the JPY as the 145.00 psychological level per US dollar seems to be a defence level where Japan’s Finance Ministry may intervene in the foreign exchange market.
The USD/JPY rallied to print an intraday high of 145.07 after the release of the leading Tokyo-area inflation data for June has indicated that sticky inflation remains elevated in Japan where the core-core rate (excluding food & energy) rose to 2.3% year-on-year, slightly below 2.4% recorded in May but still hovering close to a 30-year high. The USD/JPY has inched lower by -0.06% intraday to 144.73 at this time of the writing.
In another round of verbal intervention from Japanese officials this morning to talk down the USD/JPY’s strength, Finance Minister Suzuki commented that sharp, one-side movements had been seen in the foreign exchange (FX) market, closely watching FX market with a great sense of urgency, authorities will respond appropriately if FX moves become excessive, and current situation not positive to current policy issues.
These latest comments echoed a similar tone and rhetoric made earlier by Vice Finance Minister Kanda, a top currency official on Monday. Hence, it seems that Japanese officials are getting uneasy about the recent swift pace of the up move seen in the USD/JPY, watch the key near-term support zone of 142.50/25.
Content is for general information purposes only. It is not investment advice or a solution to buy or sell securities. Opinions are the authors; not necessarily that of OANDA Business Information & Services, Inc. or any of its affiliates, subsidiaries, officers or directors. If you would like to reproduce or redistribute any of the content found on MarketPulse, an award winning forex, commodities and global indices analysis and news site service produced by OANDA Business Information & Services, Inc., please access the RSS feed or contact us at info@marketpulse.com. Visit https://www.marketpulse.com/ to find out more about the beat of the global markets. © 2023 OANDA Business Information & Services Inc.
Latest posts by Kelvin Wong (see all)
- SEO Powered Content & PR Distribution. Get Amplified Today.
- PlatoData.Network Vertical Generative Ai. Empower Yourself. Access Here.
- PlatoAiStream. Web3 Intelligence. Knowledge Amplified. Access Here.
- PlatoESG. Automotive / EVs, Carbon, CleanTech, Energy, Environment, Solar, Waste Management. Access Here.
- BlockOffsets. Modernizing Environmental Offset Ownership. Access Here.
- Source: https://www.marketpulse.com/indices/bullish-us-stocks-and-bearish-jpy-at-risk-of-pain-trade-in-h2/kwong
- :has
- :is
- :not
- :where
- ][p
- $UP
- 07
- 1
- 10
- 100
- 15 years
- 15%
- 1999
- 20
- 2022
- 2023
- 23
- 25
- 30
- 32
- 500
- a
- About
- above
- access
- activities
- addition
- advice
- affiliates
- After
- AI
- among
- an
- analysis
- and
- Another
- any
- approaching
- appropriately
- April
- ARE
- around
- artificial
- artificial intelligence
- Artificial intelligence (AI)
- AS
- asset
- At
- author
- Authorities
- authors
- avatar
- award
- backstop
- Bank
- Banking
- based
- basis
- BE
- bearish
- become
- been
- before
- below
- Benchmark
- BEST
- Bit
- bond
- bond market
- Bond yields
- Box
- bubble
- Bullish
- Bulls
- business
- but
- buy
- by
- cannot
- captured
- cautious
- certain
- Channel
- Chart
- chicago
- China
- classes
- click
- Close
- closely
- closer
- closing
- COM
- combination
- coming
- commented
- comments
- Commodities
- condition
- conditions
- conducted
- Connecting
- contact
- content
- continued
- Cost
- Costs
- could
- courses
- Currency
- Current
- curve
- daily
- data
- decrease
- defence
- different
- Directors
- Dollar
- DOT
- down
- downward
- driven
- due
- Earlier
- Early
- Economic
- elevated
- Elliott
- emergence
- energy
- enlarge
- Ether (ETH)
- Except
- exception
- exchange
- excluding
- expected
- experience
- expert
- eye
- finance
- FINANCE MINISTER
- finance ministry
- financial
- Find
- First
- flow
- food
- For
- foreign
- foreign exchange
- foreign exchange market
- forex
- found
- from
- fund
- fundamental
- funding
- further
- future
- FX
- Gain
- gained
- General
- get
- getting
- Global
- global markets
- great
- had
- Half
- Have
- hence
- High
- higher
- highest
- Hit
- HTTPS
- ICE
- if
- immediate
- implied
- in
- Inc.
- Increase
- index
- indicated
- indicates
- Indices
- inflation
- Inflation remains elevated
- information
- Intelligence
- Intermediate
- intervene
- intervention
- inversion
- investment
- issues
- IT
- ITS
- Japan
- Japan’s
- Japanese
- JPY
- june
- Kelvin
- Key
- key resistance
- Last
- latest
- lead
- leading
- Led
- Level
- levels
- Leverage
- like
- LIMIT
- Liquidity
- Low
- lower
- lowest
- lowest level
- Macro
- made
- major
- March
- Market
- market outlook
- market research
- MarketPulse
- Markets
- max-width
- May..
- measures
- minister
- ministry
- Moments
- Momentum
- Monday
- more
- morning
- move
- movement
- movements
- moves
- Nasdaq
- Nasdaq 100
- National
- Nations
- necessarily
- news
- next
- now
- numerous
- october
- of
- officers
- official
- officials
- on
- only
- Opinions
- Optimism
- Options
- or
- out
- Outlook
- over
- Pace
- Pain
- participants
- passionate
- path
- performance
- performances
- periods
- perspectives
- photo
- Place
- plato
- Plato Data Intelligence
- PlatoData
- please
- points
- policy
- positioning
- positive
- Posts
- potential
- pressure
- Prices
- Prior
- Produced
- productivity
- programme
- providing
- purposes
- Q2
- rally
- Rate
- rebalancing
- recent
- recorded
- regional
- release
- remained
- remains
- research
- Resistance
- Respond
- retail
- Reversal
- right
- Risk
- ROSE
- round
- rss
- ruled
- S&P
- S&P 500
- same
- Second
- Securities
- see
- seems
- seen
- sees
- sell
- senior
- sense
- Sense of Urgency
- Series
- service
- Services
- sharing
- sharp
- significantly
- similar
- since
- Singapore
- site
- situation
- solution
- Source
- sovereign
- specializing
- spread
- started
- Stellar
- sticky
- Still
- stock
- Stock markets
- Stocks
- Strategist
- strength
- subsided
- Suggests
- support
- Supported
- SWIFT
- Talk
- Technical
- Technical Analysis
- Technologies
- Technology
- ten
- term
- thanks
- that
- The
- The Future
- their
- this
- thousands
- three
- tighter
- time
- to
- TONE
- top
- trade
- Traders
- Trading
- TradingView
- Training
- treasury
- Treasury yields
- Trend
- Trends
- unique
- Upside
- uptrend
- upward
- urgency
- us
- US Dollar
- US stocks
- US Treasury
- US treasury yields
- USD/JPY
- using
- v1
- Versus
- via
- vice
- Visit
- Volatility
- Watch
- watching
- Wave
- weakness
- week
- WELL
- which
- will
- winning
- with
- wong
- would
- writing
- years
- yesterday
- Yield
- yield curve
- yields
- you
- zephyrnet