- Ethereum whales own 30% more ETH than a year ago.
- A potential rally hinges on $2128 and critical support is on $2068.
In a tumultuous November for the crypto sphere, altcoins soared to unprecedented heights only to be swiftly brought down, tracing volatile patterns that tested support lines. Ethereum, the leading altcoin, surged to a seven-month high of $2140 in the second week of this month before succumbing to volatility in subsequent days. But ultimately it registered a 15% surge over thirty days. Presently, it stands at $2049, marking a 2% decline amidst a broader 1.21% decrease in the global market cap.
The prevailing sentiment seems to favor the bears, with the bulls gearing up for an uphill struggle to regain lost ground. This bearish trend has notably impacted the market capitalization, witnessing a 2% decline in the past 24 hours. However, amidst this downturn, trading volume surged by a staggering 71%, now resting at $8 billion.
The surge in trading volume often reflects investor confidence, a sentiment further supported by observations of whale accumulation in Ethereum. Noted crypto analyst Ali has identified a consistent accumulation trend among Ethereum whales, spanning nine consecutive days—a feat unseen in nine months. This accumulation trend signals a notable increase in buying pressure. It potentially paves the way for bullish price action, according to Ali’s analysis.
Additionally, on-chain data reveals that large whale addresses now hold over 30% more ETH compared to a year ago, signifying significant ownership consolidation.
Meanwhile, the Ethereum community remains abuzz with anticipation for a bullish turn in the coming year, buoyed by forthcoming updates. Key among these are developments such as EIP 4844, expected to reduce Layer 2 fees, the prospect of a spot ETH ETF, and increasing adoption of Layer 2 solutions. And the ongoing reduction of ETH through burning, staking, and withdrawal from exchanges.
Will the Ethereum Bulls win over?
Analyzing Ethereum’s price movements presents a battleground between bullish and bearish forces. The daily chart reveals the 9-day exponential moving average (EMA) positioned below the current trading price at $2043. Meanwhile, the daily relative strength index (RSI) indicates a neutral condition, standing at 58.
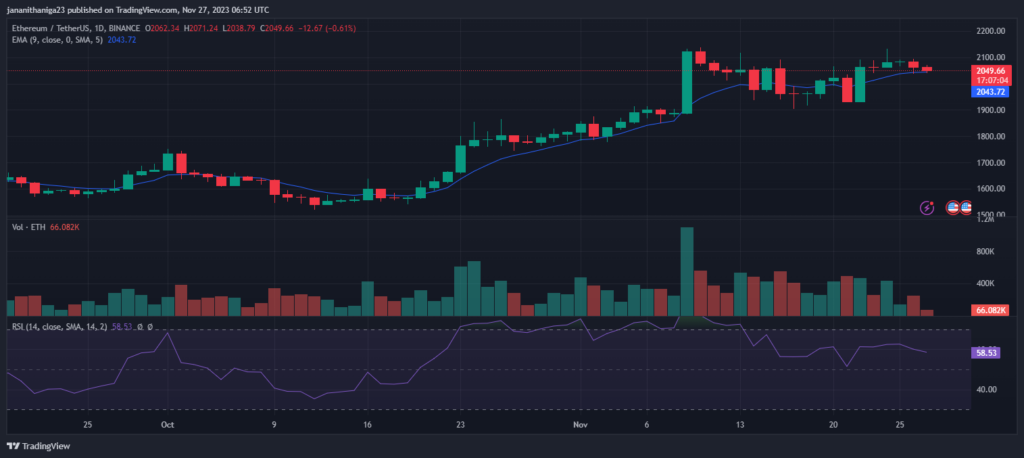
Further, a potential rally beyond the $2128 level could propel Ethereum toward testing the $2334 resistance level. Conversely, breaching the $2068 support level might pave the way for testing the $2000 threshold.
- SEO Powered Content & PR Distribution. Get Amplified Today.
- PlatoData.Network Vertical Generative Ai. Empower Yourself. Access Here.
- PlatoAiStream. Web3 Intelligence. Knowledge Amplified. Access Here.
- PlatoESG. Carbon, CleanTech, Energy, Environment, Solar, Waste Management. Access Here.
- PlatoHealth. Biotech and Clinical Trials Intelligence. Access Here.
- Source: https://thenewscrypto.com/can-ethereum-break-free-from-its-sluggish-momentum/
- :has
- :is
- $UP
- 1
- 15%
- 2%
- 24
- 26
- 36
- 58
- a
- According
- accumulation
- Action
- addresses
- Adoption
- ago
- Altcoin
- Altcoins
- amidst
- among
- an
- analysis
- analyst
- and
- anticipation
- ARE
- AS
- At
- average
- battleground
- BE
- bearish
- Bears
- before
- below
- between
- Beyond
- Billion
- Break
- broader
- brought
- Bullish
- Bulls
- burning
- but
- Buying
- by
- CAN
- cap
- capitalization
- Chart
- coming
- community
- compared
- condition
- confidence
- consecutive
- consistent
- consolidation
- conversely
- could
- critical
- crypto
- crypto analyst
- Current
- daily
- data
- Days
- Decline
- decrease
- developments
- down
- DOWNTURN
- EIP
- EMA
- ETF
- ETH
- Ether (ETH)
- ethereum
- ethereum bulls
- ethereum whales
- Ethereum's
- Exchanges
- expected
- exponential
- exponential moving average
- favor
- feat
- Fees
- For
- Forces
- forthcoming
- Free
- from
- further
- gearing
- Global
- global market
- Ground
- heights
- High
- hinges
- hold
- HOURS
- However
- HTTPS
- identified
- impacted
- in
- Increase
- increasing
- index
- indicates
- investor
- IT
- ITS
- Key
- large
- layer
- Layer 2
- leading
- Level
- lines
- lost
- Market
- Market Cap
- Market Capitalization
- marking
- max-width
- Meanwhile
- might
- Momentum
- Month
- months
- more
- movements
- moving
- moving average
- Neutral
- nine
- notable
- notably
- noted
- November
- now
- observations
- of
- often
- on
- On-Chain
- on-chain data
- ongoing
- only
- over
- own
- ownership
- past
- patterns
- pave
- paves
- PHP
- plato
- Plato Data Intelligence
- PlatoData
- positioned
- potential
- potentially
- presently
- presents
- pressure
- prevailing
- price
- PRICE ACTION
- price chart
- Propel
- prospect
- rally
- reduce
- reduction
- reflects
- regain
- registered
- relative
- relative strength index
- Relative Strength Index (RSI)
- remains
- Resistance
- resting
- Reveals
- rsi
- Second
- seems
- sentiment
- Share
- signals
- significant
- signifying
- sluggish
- soared
- Solutions
- Source
- spanning
- Spot
- staggering
- Staking
- standing
- stands
- strength
- Struggle
- subsequent
- succumbing
- such
- support
- support level
- Supported
- surge
- Surged
- SVG
- swiftly
- tested
- Testing
- than
- that
- The
- These
- thirty
- this
- threshold
- Through
- to
- toward
- Tracing
- Trading
- trading volume
- Trend
- TURN
- Ultimately
- unprecedented
- Updates
- volatile
- Volatility
- volume
- Way..
- week
- Whale
- Whale Accumulation
- whale addresses
- whales
- win
- with
- withdrawal
- witnessing
- year
- zephyrnet