Trend Reversal Strategies are the type of strategies that tend to have a lower win rate. However, it also tends to produce very high yields on some of its winning trades. This is because trend reversals assume that the market would start to trend in the opposite direction. Traders who were able to trade right at the beginning of the trend could potentially make a lot of money whenever they are right.
If you would want to trade trend reversals, it is in your best interest to learn how to increase your chances of getting a winning trade. One way to do this is to look for a confluence of indications and signals that the market is about to reverse.
This trading strategy is a trend reversal strategy which trades on a confluence of divergences, a high probability candlestick pattern, and a short-term moving average line crossover. It does this using a pair of moving averages, the Patterns on Chart indicator and the CCI Divergence indicator.
Divergences and the CCI Divergence Indicator
Price action normally oscillates up and down the price chart with a series of rallies and drops. This is just the nature of the market and of price movements. These rallies and drops form peaks and dips which are commonly called swing highs and swing lows or pivot highs and pivot lows.
There are also technical indicators that mimic the movements and oscillations of price action. These indicators are called oscillators. Oscillators follow the movements of price action on their own indicator window and within their own ranges. Since oscillators mimic the movements of price action, they also tend to have peaks and dips that are closely congruent to the swing highs and swing lows of price action. Often, the intensity of the peaks and dips are also similar. However, there are also times when the height or depth of the peak or dip of an oscillator would vary with that on the swing highs or swing lows. These scenarios are what we call divergences and are good indications of a possible trend reversal.

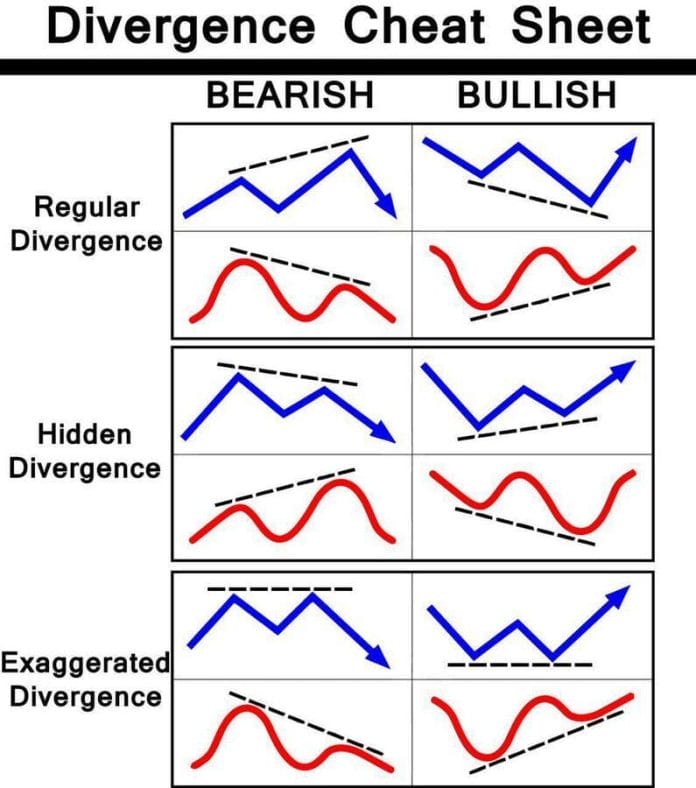
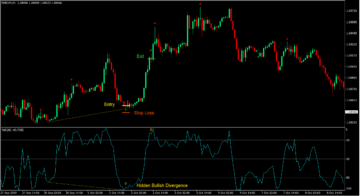
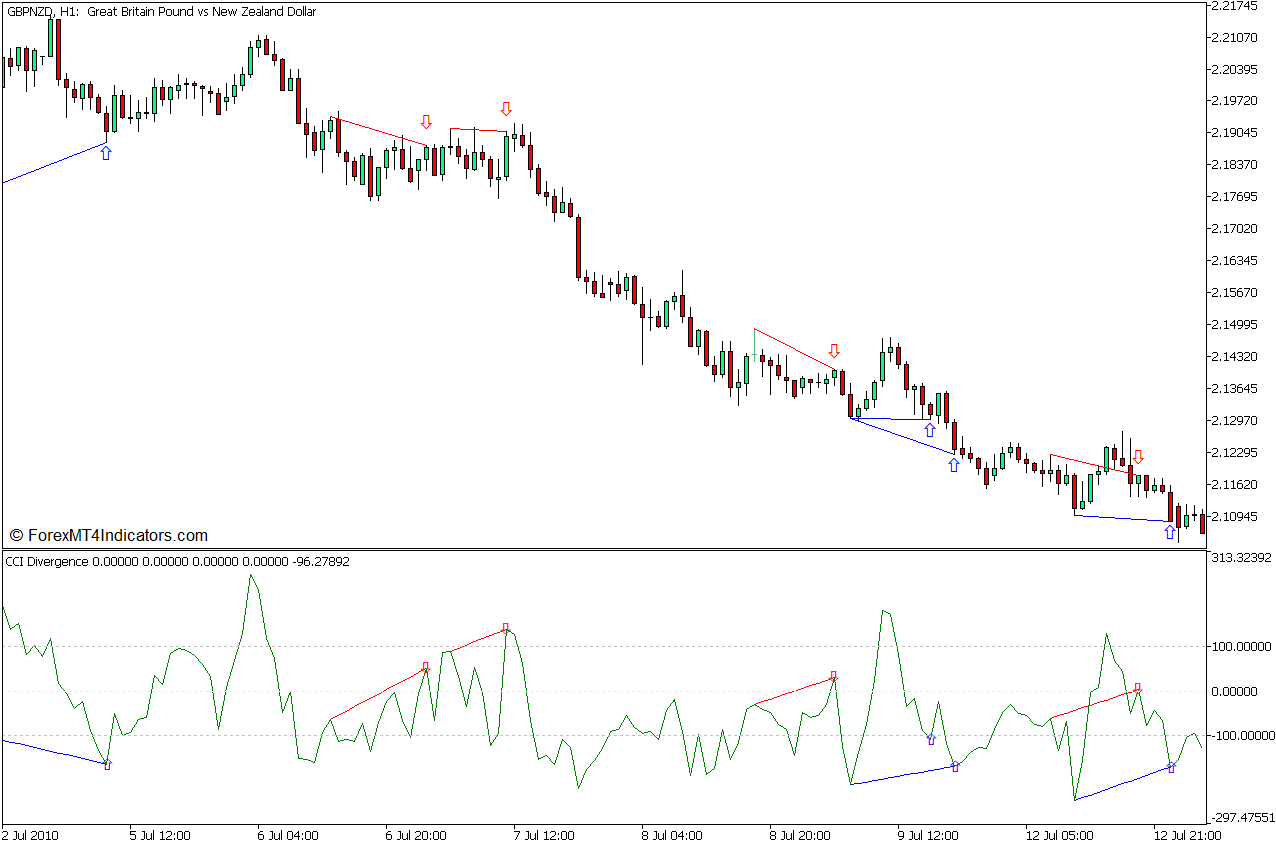
The CCI Divergence Indicator is a custom technical indicator that automatically identifies various divergence patterns on the Commodity Channel Index (CCI) oscillators. It plots solid lines to indicate a regular divergence and dotted lines to indicate a hidden divergence. It plots lines below price action and below an oscillator to indicate a bullish divergence, and above price action and an oscillator to indicate a bearish divergence. It also conveniently plots an arrow pointing the direction of the possible reversal.

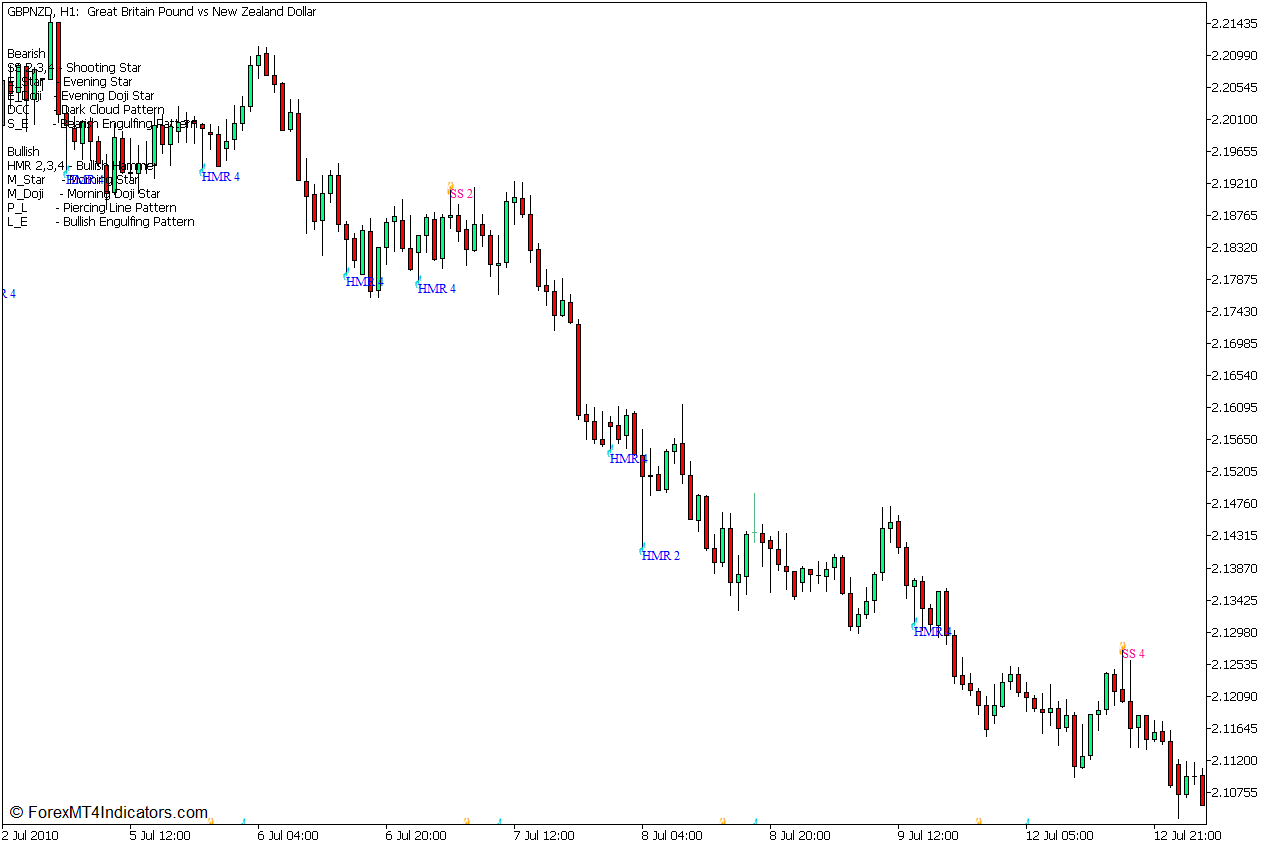
Patterns on Chart Indicator – Hammer and Shooting Star Patterns
Candlestick patterns are excellent telltale signs of a possible reversal. Among the reversal candlestick patterns, the Hammer and Shooting Star pattern are one of the most popular reversal candlestick patterns.
Hammer patterns are bullish single candle reversal patterns with a long wick at the bottom and a small body at the top. Shooting Star patterns are the exact opposite. They are bearish reversal patterns with a long wick at the top and a small body at the bottom.
These patterns tell us that the market quickly reversed against the prior momentum direction which formed the long wicks and short body.
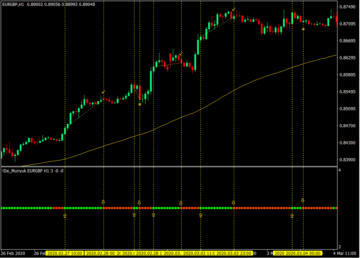
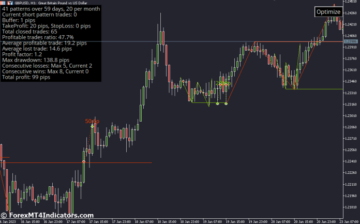
The Pattern on Chart Indicator is a technical indicator that automatically identifies various reversal candlestick patterns. It identifies these patterns using an algorithm that objectively identifies the patterns based on their characteristic definition. It then labels the candlestick patterns to indicate which type of pattern is identified. It also shows the corresponding candlestick name on the upper left corner of the chart.
The Hammer and Shooting Star patterns are two patterns that the Patterns on Chart indicator can effectively identify.

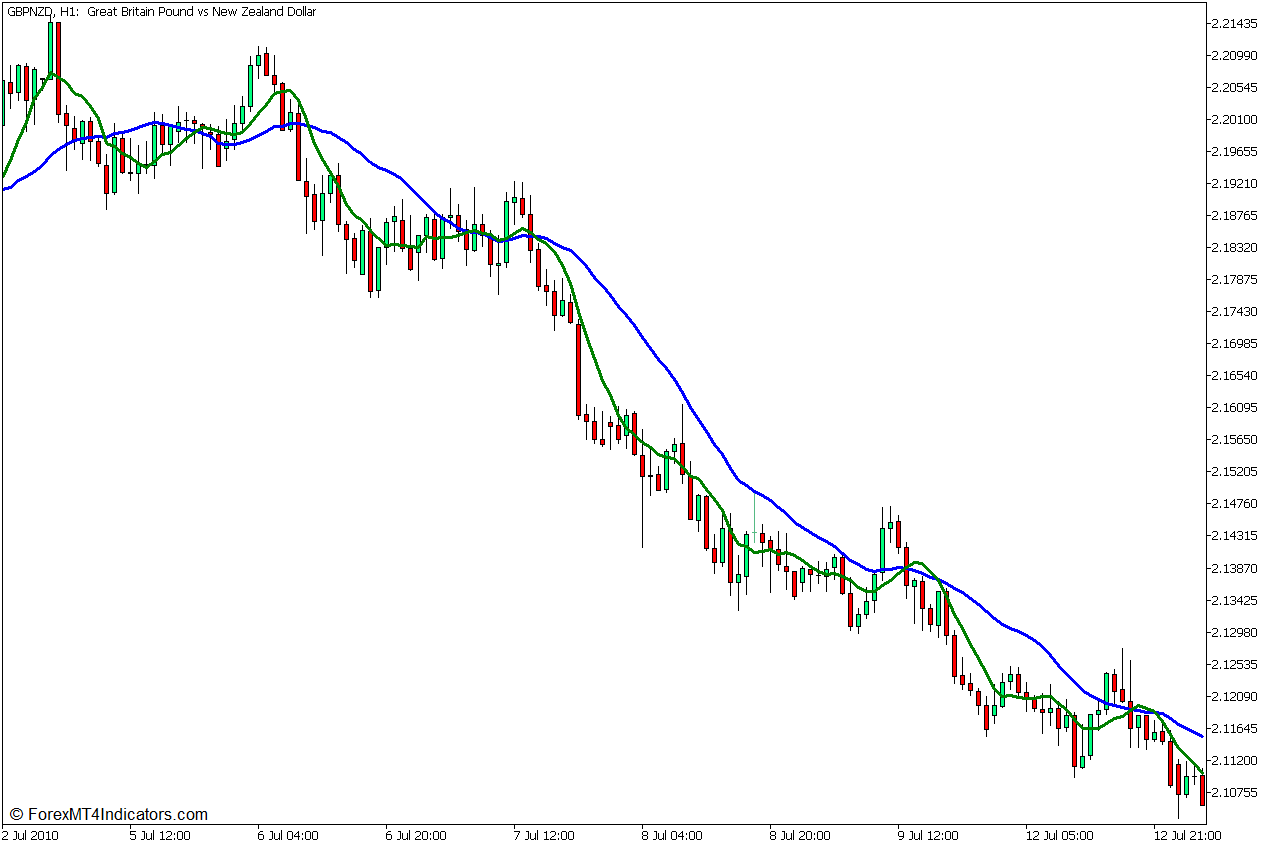
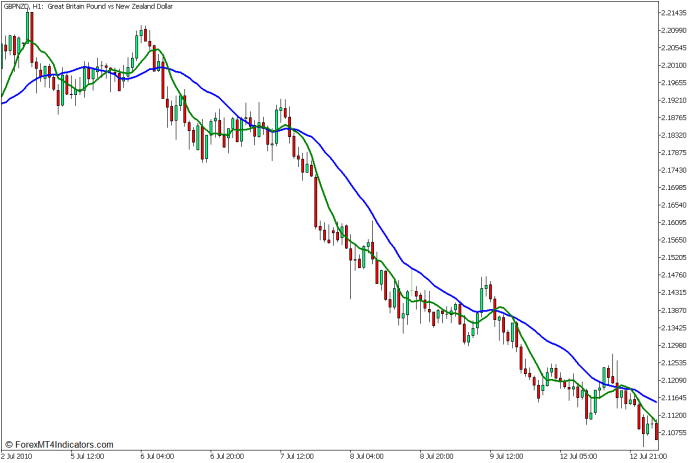
7-21 Crossover
One of the ways traders identify trend reversals is with the use of moving average crossovers. This is a simple method that can also produce good signals when combined with other indications.
The 7-bar Simple Moving Average (SMA) and 21-bar Simple Moving Average (SMA) are an excellent moving average crossover pair for identifying short-term trend reversals.
Trading Strategy Concept
This trading strategy is a trend reversal trading strategy that anticipates trend reversals using a confluence of divergences and reversal candlestick patterns.
Trade signals are generated based on the confluence of divergence signals using the CCI Divergence Indicator and Hammer and Shooting Star patterns using the Patterns on Chart Indicator.
The 7 SMA and 21 SMA moving average lines are used as a confirmation of the trend reversal as well as an indication of the possible end of the new trend, which would also be the signal to close the trade.
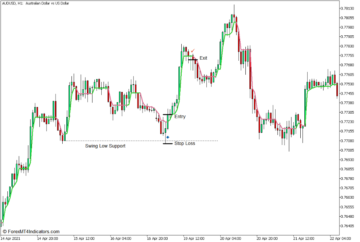
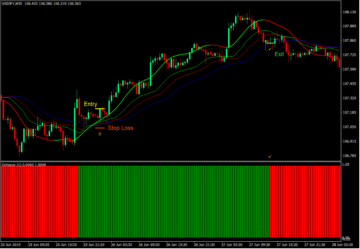
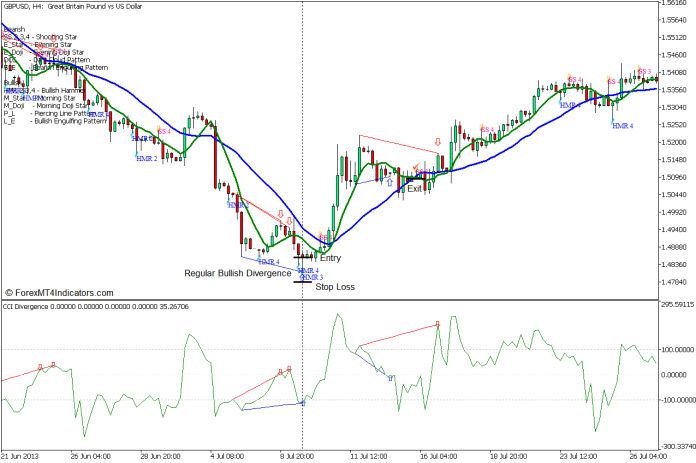
Buy Trade Setup
Entry
- A bullish divergence should be indicated by the CCI Divergence indicator.
- The Patterns on the Chart indicator should also identify a Hammer pattern.
- Enter a buy order on the confluence of these two trend reversal signals.
Stop Loss
- Set the stop loss several pips below the hammer pattern.
Exit
- Allow the price to trend in the opposite direction and exit the trade as soon as the 7 SMA line crosses below the 21 SMA line.

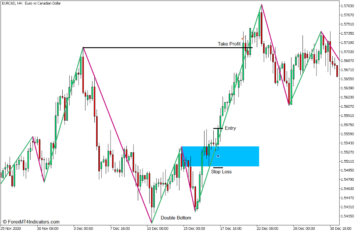
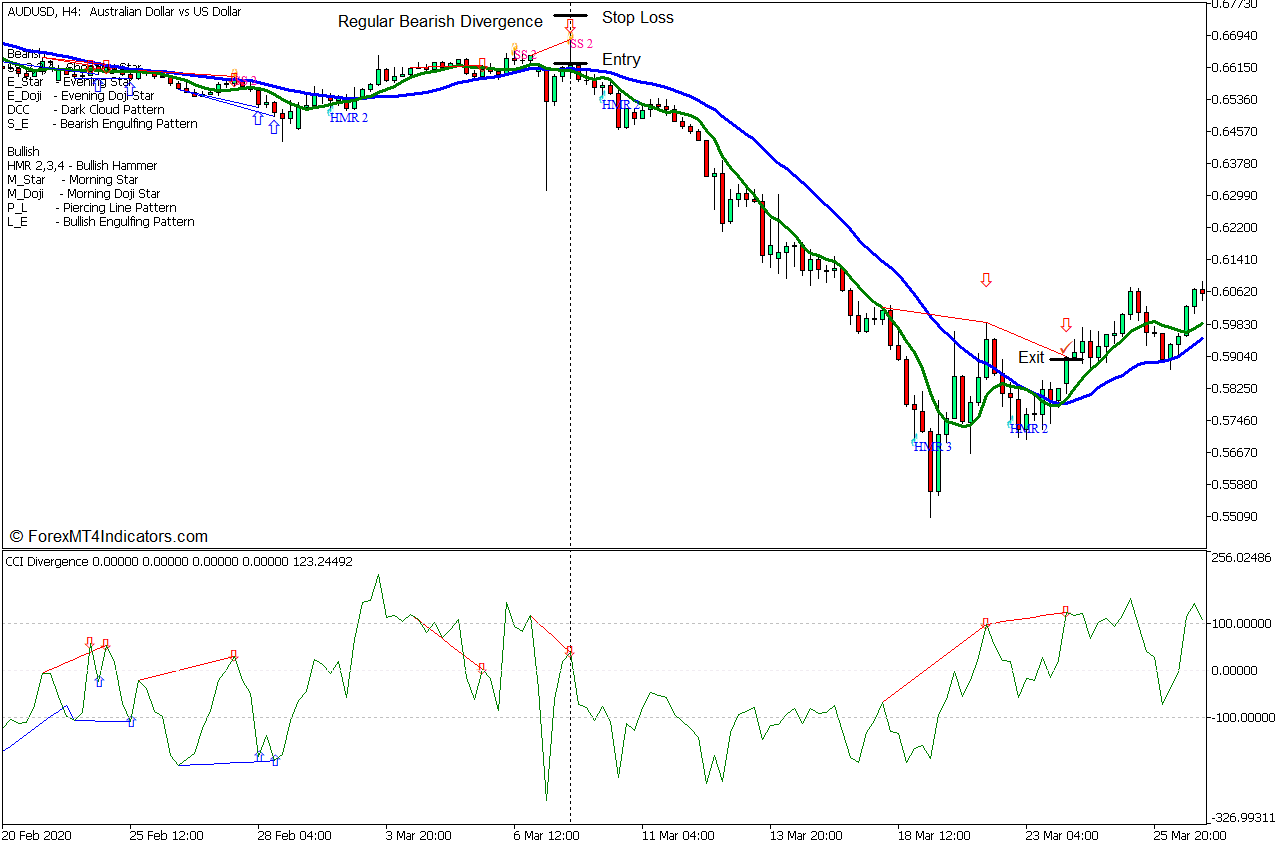
Sell Trade Setup
Entry
- A bearish divergence should be indicated by the CCI Divergence indicator.
- The Patterns on Chart indicator should also identify a Shooting Star pattern.
- Enter a sell order on the confluence of these two trend reversal signals.
Stop Loss
- Set the stop loss several pips above the shooting star pattern.
Exit
- Allow price to trend in the opposite direction and exit the trade as soon as the 7 SMA line crosses above the 21 SMA line.
Conclusion
This trading strategy trades trend reversal signals before the actual occurrence of a trend reversal. As such, it is quite a risky trade setup. However, it also has a good chance of resulting in a trend because of the combination of the two strong reversal signals. This is also why we should trade only when these two signals are closely aligned and are in confluence.
The good thing about this strategy is that it allows for really high yields on its winning trades because it enters a trade before a confirmed trend reversal and tries to hold on to the trade as long as the short-term trend is still in place. This allows for profitable trades that would run for quite some time and earn huge profits.
Recommended MT5 Broker
- Free $50 To Start Trading Instantly! (Withdrawable Profit)
- Deposit Bonus up to $5,000
- Unlimited Loyalty Program
- Award Winning Forex Broker
- Additional Exclusive Bonuses Throughout The Year

>> Claim Your $50 Bonus Here <<
Click here below to download:
Save
Save
- SEO Powered Content & PR Distribution. Get Amplified Today.
- PlatoData.Network Vertical Generative Ai. Empower Yourself. Access Here.
- PlatoAiStream. Web3 Intelligence. Knowledge Amplified. Access Here.
- PlatoESG. Carbon, CleanTech, Energy, Environment, Solar, Waste Management. Access Here.
- PlatoHealth. Biotech and Clinical Trials Intelligence. Access Here.
- Source: https://www.forexmt4indicators.com/candlestick-rejection-and-divergence-forex-trading-strategy-for-mt5/?utm_source=rss&utm_medium=rss&utm_campaign=candlestick-rejection-and-divergence-forex-trading-strategy-for-mt5
- :has
- :is
- $UP
- 21
- 7
- 900
- a
- Able
- About
- above
- Action
- actual
- against
- algorithm
- aligned
- allows
- also
- among
- an
- and
- anticipates
- ARE
- AS
- assume
- At
- automatically
- average
- based
- BE
- bearish
- bearish divergence
- because
- before
- Beginning
- below
- BEST
- body
- Bonus
- Bottom
- Bullish
- bullish divergence
- buy
- by
- call
- called
- CAN
- Chance
- chances
- Channel
- characteristic
- Chart
- claim
- Close
- closely
- combination
- combined
- commodity
- commonly
- confirmation
- CONFIRMED
- confluence
- conveniently
- Corner
- Corresponding
- could
- custom
- definition
- depth
- Dip
- direction
- Divergence
- do
- does
- down
- download
- Drops
- earn
- effectively
- end
- Enters
- entry
- exact
- excellent
- Exclusive
- Exit
- follow
- For
- forex
- Forex Trading
- form
- formed
- generated
- getting
- good
- hammer
- Have
- height
- here
- Hidden
- High
- Highs
- hold
- How
- How To
- However
- HTTPS
- huge
- identified
- identifies
- identify
- identifying
- in
- Increase
- index
- indicate
- indicated
- indication
- indications
- Indicator
- Indicators
- interest
- IT
- ITS
- jpg
- just
- Labels
- LEARN
- left
- Line
- lines
- Long
- Look
- loss
- Lot
- lower
- Lows
- Loyalty
- make
- Market
- max-width
- method
- Momentum
- money
- most
- Most Popular
- movements
- moving
- moving average
- moving averages
- name
- Nature
- New
- normally
- objectively
- occurrence
- of
- often
- on
- ONE
- only
- opposite
- or
- order
- Other
- own
- pair
- Pattern
- patterns
- Peak
- PHP
- Pivot
- Place
- plato
- Plato Data Intelligence
- PlatoData
- Popular
- possible
- potentially
- price
- PRICE ACTION
- price chart
- Prior
- probability
- produce
- Profit
- profitable
- profits
- quickly
- quite
- rallies
- ranges
- Rate
- really
- regular
- resulting
- Reversal
- reversals
- reverse
- right
- Risky
- Run
- scenarios
- sell
- Series
- setup
- several
- shooting
- Short
- short-term
- should
- Shows
- Signal
- signals
- Signs
- similar
- Simple
- since
- single
- SMA
- small
- solid
- some
- Soon
- Star
- start
- Still
- Stop
- strategies
- Strategy
- strong
- such
- Swing
- Technical
- tell
- tend
- tends
- that
- The
- their
- then
- There.
- These
- they
- thing
- this
- throughout
- time
- times
- to
- top
- trade
- Traders
- trades
- Trading
- trading strategy
- Trend
- tries
- two
- type
- us
- use
- used
- using
- various
- vary
- very
- want
- Way..
- ways
- we
- WELL
- were
- What
- when
- whenever
- which
- WHO
- why
- win
- window
- winning
- with
- within
- would
- yields
- you
- Your
- zephyrnet