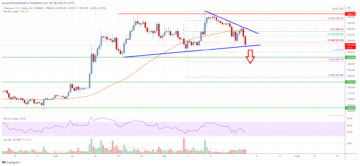
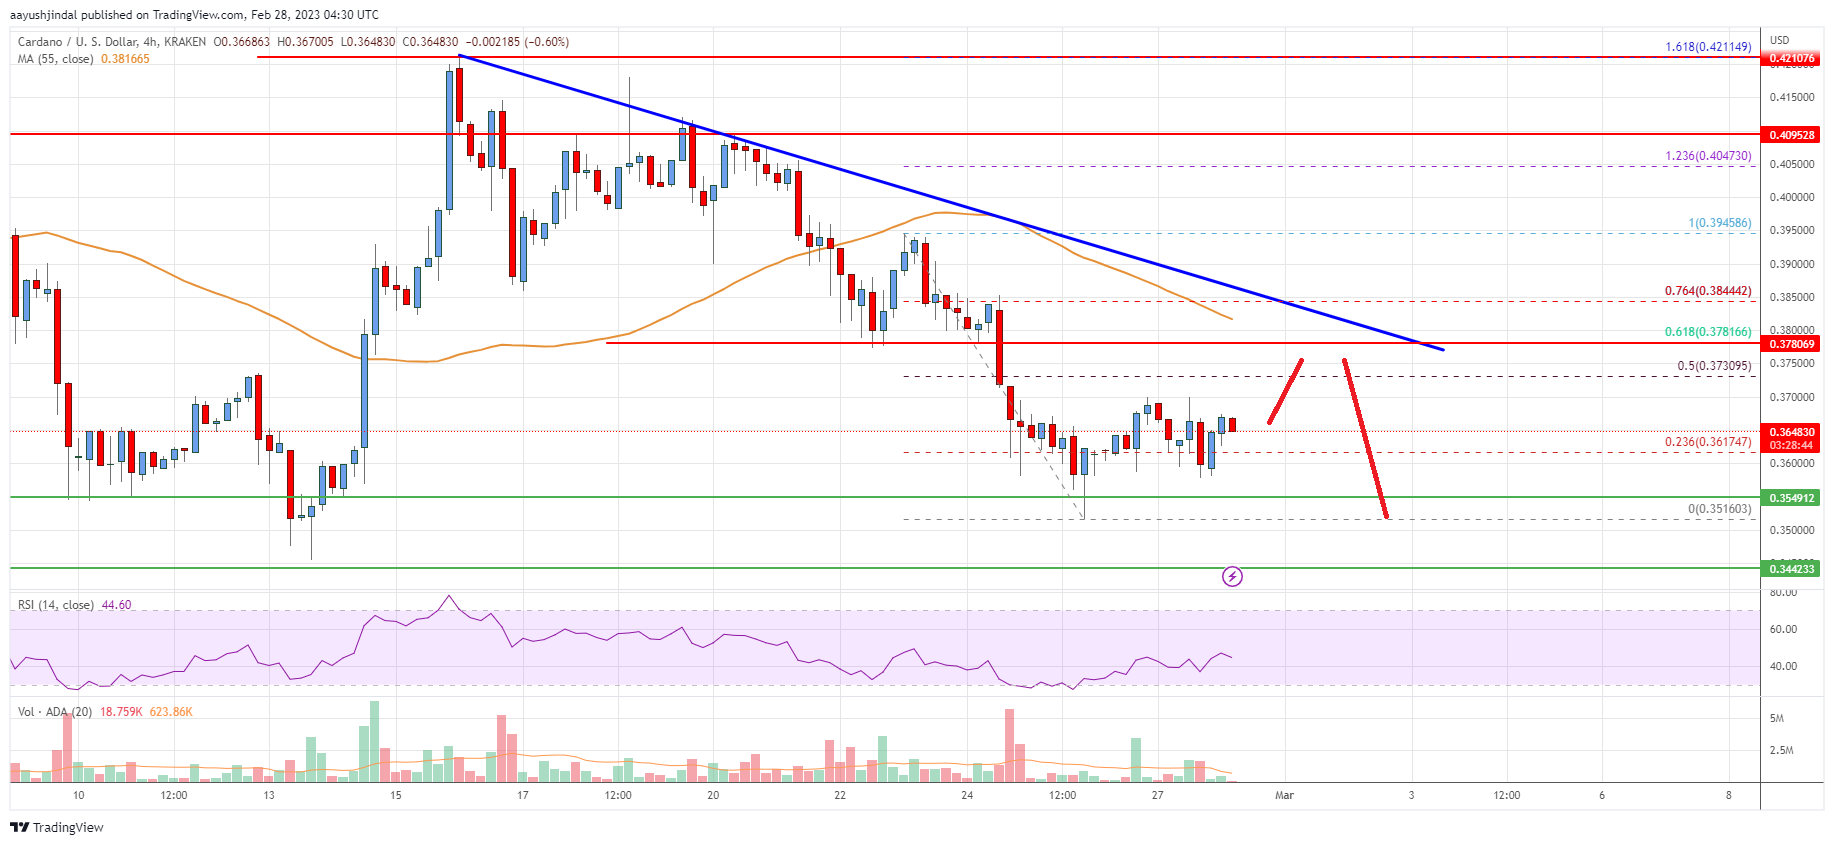
- ADA price is trading in a bearish zone below the $0.38 support zone against the US Dollar.
- The price is now trading below $0.38 and the 55 simple moving average (4-hours).
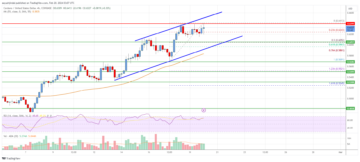
- There is a major bearish trend line forming with resistance near $0.3780 on the 4-hours chart (data feed via Kraken).
- The price could continue to move down if it stays below the $0.3800 resistance zone.
Cardano price is struggling below $0.38 against the US Dollar, similar to bitcoin. ADA price could start a recovery wave if it clears the $0.378 and $0.380 resistance levels.
Cardano Price Analysis
In the past few days, cardano price saw a fresh decline below the $0.400 zone against the US Dollar. The ADA/USD pair declined below the $0.388 and $0.380 support levels.
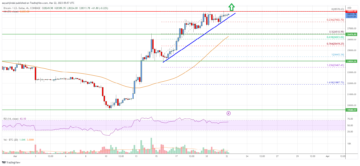
The price even declined below the $0.370 support and the 55 simple moving average (4-hour). A low was formed near $0.3516 and the price is now consolidating losses. The price is now trading below $0.375 and the 55 simple moving average (4-hours).
On the upside, an immediate resistance is near the $0.374 zone. It is near the 50% Fib retracement level of the downward move from the $0.3945 swing high to $0.3516 low.
The first major resistance is near the $0.378 level. There is also a major bearish trend line forming with resistance near $0.3780 on the 4-hours chart. The trend line is near the 61.8% Fib retracement level of the downward move from the $0.3945 swing high to $0.3516 low.
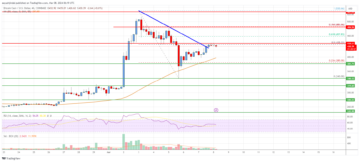
The next major resistance could be near the $0.384 zone and the 55 simple moving average (4-hour). A clear upside break above the $0.384 level might send the price towards the $0.400 resistance. Any more gains could start a steady increase towards the $0.422 level.
On the downside, an immediate support is near the $0.354 level. The next major support is near the $0.344 level, below which the price may perhaps decline towards the $0.322 support level. Any more losses might call for a test of the $0.300 level.
Cardano (ADA) Price
The chart indicates that ADA price is now trading below $0.380 and the 55 simple moving average (4-hours). Overall, the price could continue to move down if it stays below the $0.378 resistance zone.
Technical Indicators
4 hours MACD – The MACD for ADA/USD is now losing pace in the bearish zone.
4 hours RSI – The RSI for ADA/USD is now below the 50 level.
Key Support Levels – $0.354 and $0.344.
Key Resistance Levels – $0.378 and $0.384.
- SEO Powered Content & PR Distribution. Get Amplified Today.
- Platoblockchain. Web3 Metaverse Intelligence. Knowledge Amplified. Access Here.
- Source: https://www.livebitcoinnews.com/cardano-ada-price-analysis-risk-of-drop-below-0-35/
- a
- above
- ADA
- ada price
- ADA/USD
- against
- analysis
- and
- average
- bearish
- below
- Break
- call
- Cardano
- Cardano (ADA)
- cardano price
- Chart
- clear
- comments
- consolidating
- continue
- could
- data
- Days
- Decline
- Dollar
- down
- downside
- downward
- Drop
- Even
- few
- First
- follow
- formed
- fresh
- from
- Gains
- High
- HOURS
- HTTPS
- immediate
- in
- Increase
- indicates
- internal
- IT
- Kraken
- Level
- levels
- Line
- losing
- losses
- Low
- MACD
- major
- might
- more
- move
- moving
- moving average
- Near
- next
- overall
- Pace
- past
- perhaps
- plato
- Plato Data Intelligence
- PlatoData
- Post
- price
- Price Analysis
- recovery
- Resistance
- retracement
- Risk
- rsi
- similar
- Simple
- start
- steady
- Struggling
- support
- support level
- support levels
- TAG
- test
- The
- to
- towards
- Trading
- TradingView
- Trend
- Upside
- us
- US Dollar
- via
- Wave
- which
- zephyrnet