TL;DR Breakdown
- Cardano price is expected to rise to $1.48
- The closest support level is at $1.46
- Cardano price is facing resistance at the $1.50 mark
Cardano price has broken above the $1.40 mark and strong bullish momentum has carried the price to challenge the $1.48 mark. ADA records an over 13.80 percent price hike across the last seven days showing strong bullish dominance. However, the sharp bullish activity leaves room for a volatile price movement
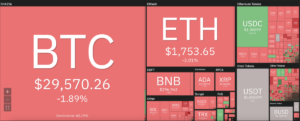
Across the broader cryptocurrency market, the last 24 hours have observed a net bullish movement, with most major cryptocurrencies recording a profit across the period. Major players include BNB and Dogecoin that record a 2.98 and a 28.2 percent increase respectively. Meanwhile Bitcoin and Ethereum record a 4.38 and a 7.18 percent hike
Technical indicators for ADA/USDT
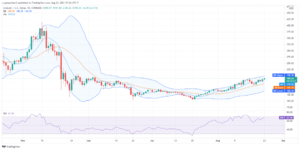
Across the technical indicators, the MACD shows a declining bullish momentum. While the histogram is still green at the time of writing, the histogram’s size has decreased significantly as the price struggled to climb back above the 0.032 mark. While the 12-EMA still trades above the 26-EMA, the difference between the two is negligible and they may show a reversal at any time.
The RSI broke out of the neutral region on August 7th into the overbought region but has since dropped back into the neutral zone. The indicator currently trades above the 64.00mark and moves upwards suggesting a bullish presence at the current price level. Moreover, the RSI trades with a steep slope suggesting low bearish momentum as the buyers appear to be fighting back.
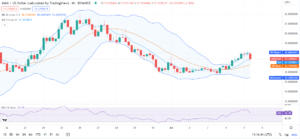
The Bollinger bands at press time are wide and as the last few candlesticks are green the bands will expand further in the immediate future. As the bulls take charge of the market momentum, it will cause the volatility of the Cardano price to increase in the short term. Moreover, as the price is consolidating closer to the upper limit rather than the band’s mean line, the bands will be leaning upwards for the next few candlesticks.
Overall the 4-hour technical analysis issues a buy signal with 15 of the total 26 major technical indicators suggesting their support for a bullish movement. On the other hand, only one indicator issues sell signals suggesting a bearish retracement. Meanwhile, indicators sit on the fence issuing no support for either side of the market.
The 24-hour technical analysis shares this sentiment and also issues a buy signal with 16 of the 26 indicators suggesting a bullish movement against only two indicators suggest a bearish retracement. Meanwhile, eight indicators remain neutral and do not issue any signals at the time of writing
What to expect from Cardano price?
Cardano price is currently facing resistance at $1.50 mark but the market shows strong bullish sentiment .The short term technical indicators and the midterm indicators support the bulls heavily .As such traders should expect the price to break above$1.48 mark. Traders can expect an upward breakthrough above the $1.50 mark if the current momentum continues
Disclaimer. The information provided is not trading advice. Cryptopolitan.com holds no liability for any investments made based on the information provided on this page. We strongly recommend independent research and/or consultation with a qualified professional before making any investment decisions. Source: https://www.cryptopolitan.com/cardano-price-analysis-2021-08-08/
- 7
- 98
- ADA
- advice
- analysis
- AUGUST
- bearish
- Bearish Momentum
- bnb
- Bullish
- Bulls
- buy
- Cardano
- cardano price
- Cause
- challenge
- charge
- closer
- cryptocurrencies
- cryptocurrency
- cryptocurrency market
- Current
- dropped
- Expand
- facing
- future
- Green
- HTTPS
- Increase
- information
- investment
- Investments
- issues
- IT
- Level
- liability
- Line
- major
- Making
- mark
- Market
- Momentum
- net
- Other
- press
- price
- Price Analysis
- Profit
- records
- research
- sell
- sentiment
- Shares
- Short
- Size
- support
- support level
- Technical
- Technical Analysis
- time
- Traders
- trades
- Trading
- Volatility
- writing