TL;DR Breakdown
- Our daily Cardano price analysis is bearish
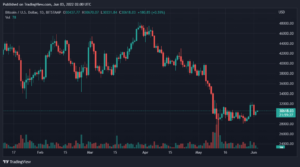
- The daily chart indicated a tight daily range of $2.7200 – $2.7790
- Bulls attempted to overcome the $2.772 price on the 4-hour chart but met rejection.
On our daily Cardano price analysis, ADA/USD pair is trading bearishly on the 24-hour candlesticks as the bears pull the market lower to the $2.77 price mark. Traders are hence anticipating the market to continue moving downwards and hit their next target support near $2.46.
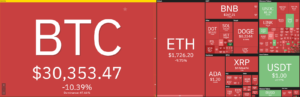
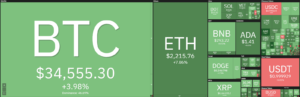
The overall cryptocurrency market is trading with mixed results. Losers include Bitcoin and Solana with a 1.24 percent and 3.45 percent loss respectively. Ethereum and Ripple gained 6.68 percent and 4.91 percent respectively. The best performer turned out to be Polkadot with a net positive gain of 15 percent.
Cardano price movement in the last 24 hours: ADA slowly retracing
The 24-hour candlesticks on our Cardano price analysis are red with little signs of volatility as indicated by the tight daily range of $2.7200 – $2.7790. Cardano’s trading volume fell by 7.2 percent since yesterday and totals $4.292 billion. ADA is ranked at position #3 by Coin Market Cap with a market capitalization of $88.08 billion.
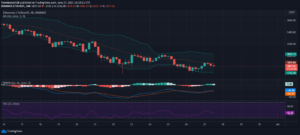
ADA/USD 4-hour chart: Are ADA bears still targeting $2.46 support again?
Our Cardano price analysis indicates the bulls have attempted to overcome the $2.772 price zone on the 4-hour chart but have met rejection. Resulting in a drop below the middle Bollinger Band line and increasing negative signals of an imminent downtrend.

Cardano price movement has posted record gains from a major swing low of $1.02, jumping almost 200 percent to the August swing high of $2.97.
The bulls might have become exhausted on approaching August 26th where they failed to breach the $2.90 resistance. Last week’s $2.46 resistance is the current support and the bears are targetting to exert a pullback towards this zone.
A situation that could once again flip the support into a price barrier. We expect the bears to take control of the price and urge traders to take advantage of any dips on the Cardano chart as the community warms up for the September 12 Alonzo upgrade.
Cardano Price Analysis: Conclusion
Our Cardano price analysis is suggesting a bearish trend over the next 24 hours. The price will decline further from the $2.9 resistance and could touch the $2.46 support. While warming for a price change on Cardano, take a look at some of our long-term price forecasts.
Disclaimer. The information provided is not trading advice. Cryptopolitan.com holds no liability for any investments made based on the information provided on this page. We strongly recommend independent research and/or consultation with a qualified professional before making any investment decisions.Source: https://api.follow.it/track-rss-story-click/v3/tHfgumto13DTF5w1yGp00vnNuMIJyU22
- 7
- 77
- 9
- ADA
- ADvantage
- advice
- analysis
- AUGUST
- bearish
- Bears
- BEST
- Billion
- breach
- Bulls
- capitalization
- Cardano
- cardano price
- change
- Coin
- community
- continue
- cryptocurrency
- cryptocurrency market
- Current
- data
- Drop
- High
- HTTPS
- information
- investment
- Investments
- liability
- Line
- major
- Making
- mark
- Market
- Market Capitalization
- mixed
- Near
- net
- price
- Price Analysis
- range
- research
- Results
- Signs
- Solana
- support
- Target
- touch
- Traders
- Trading
- Volatility
- volume