Chainlink (LINK) has experienced a surge in bullish sentiment as it rebounded from the $5 support level. In the past week, LINK has surpassed several support levels, resulting in a gain of over 20%.
Although there haven’t been significant changes on the daily chart, the technical outlook for the altcoin has turned notably bullish. Both demand and accumulation have shown significant improvement, while the overall strength of the broader market has also contributed to LINK’s upward movement.
The positive momentum in major altcoins, driven by Bitcoin surpassing the $30,000 mark, has further added to the optimism. Sustaining this price momentum will largely depend on BTC’s continued upward push.
Related Reading: Binance Rescinds Decision To Remove Privacy Coins From European Market
While a price pullback cannot be ruled out for LINK, the increased buying power should help prevent a loss of momentum. If LINK manages to maintain its nearest support level, the ongoing price rally is expected to continue as the increase in LINK’s market capitalization suggests the anticipation of further bullish gains.
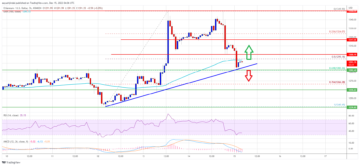
Chainlink Price Analysis: One-Day Chart

After surpassing the significant psychological level of $6, the price of LINK was $6.20. The $6 mark has demonstrated its importance as a support level and dropping below it would potentially lead to a decline toward $5.
On the other hand, if LINK manages to break the overhead resistance at $6.46, it could potentially rally to $6.70, representing a gain of over 11% in the upcoming trading sessions.
In the event of a decrease from the current price, support levels to watch out for are $5.60 and $5. The trading volume of LINK in the last session has shown an increase, indicating an influx of buyers into the market.
Technical Analysis
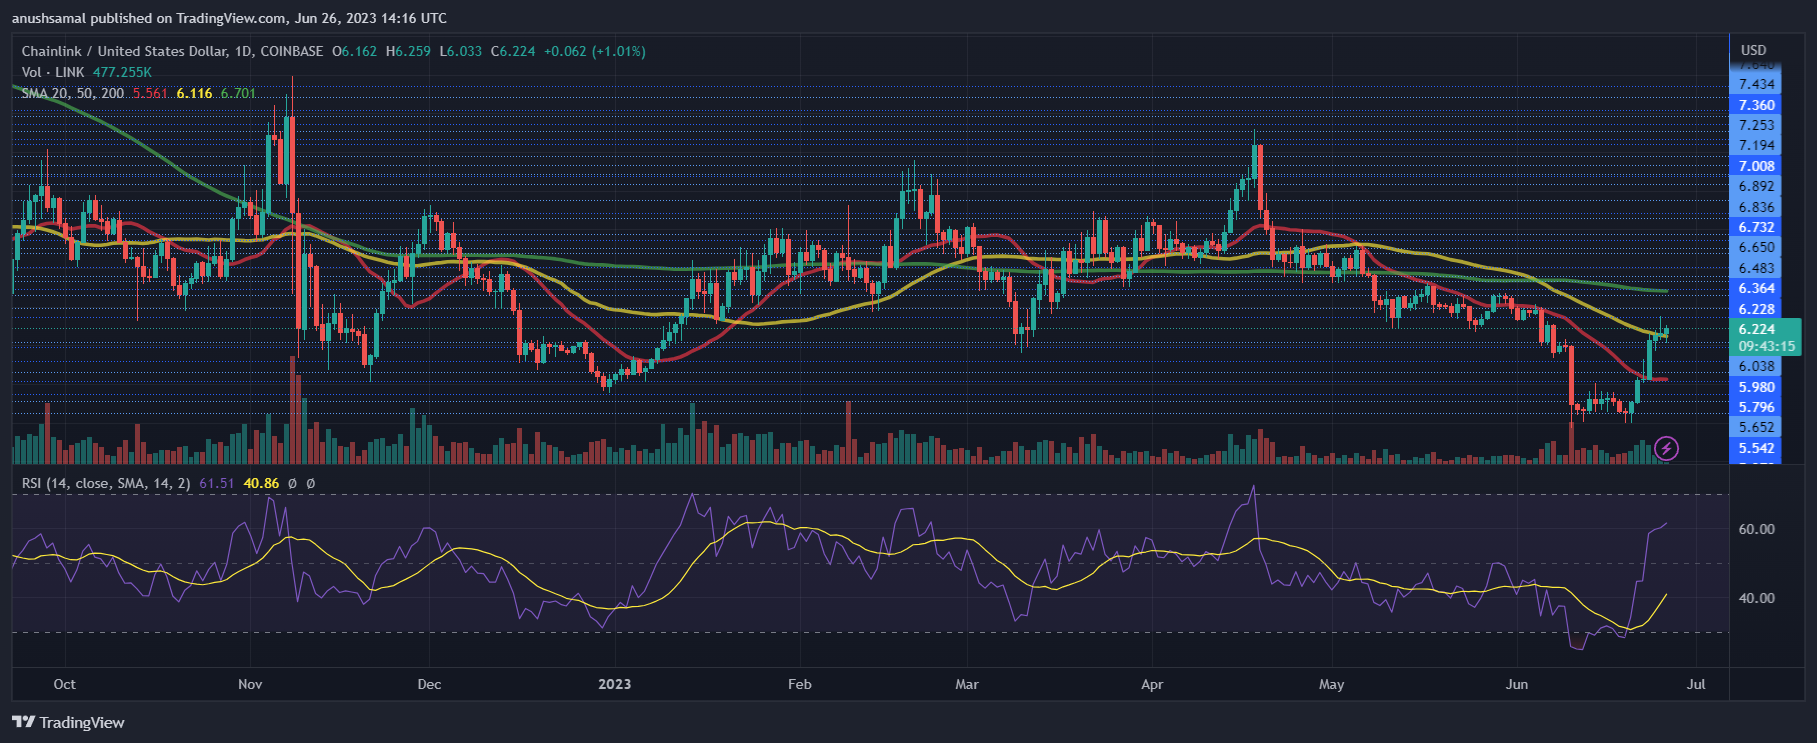
Recent trading sessions have witnessed notable improvement in buying strength for LINK. Despite a slight dip in price, the buying strength has remained stable on the chart.
This is indicated by the Relative Strength Index (RSI) surpassing the 60-mark, signaling growing demand. This suggests the potential for increased gains in the price action.
Additionally, buyers have driven the price momentum in the market, causing it to surge above the 20-Simple Moving Average line.
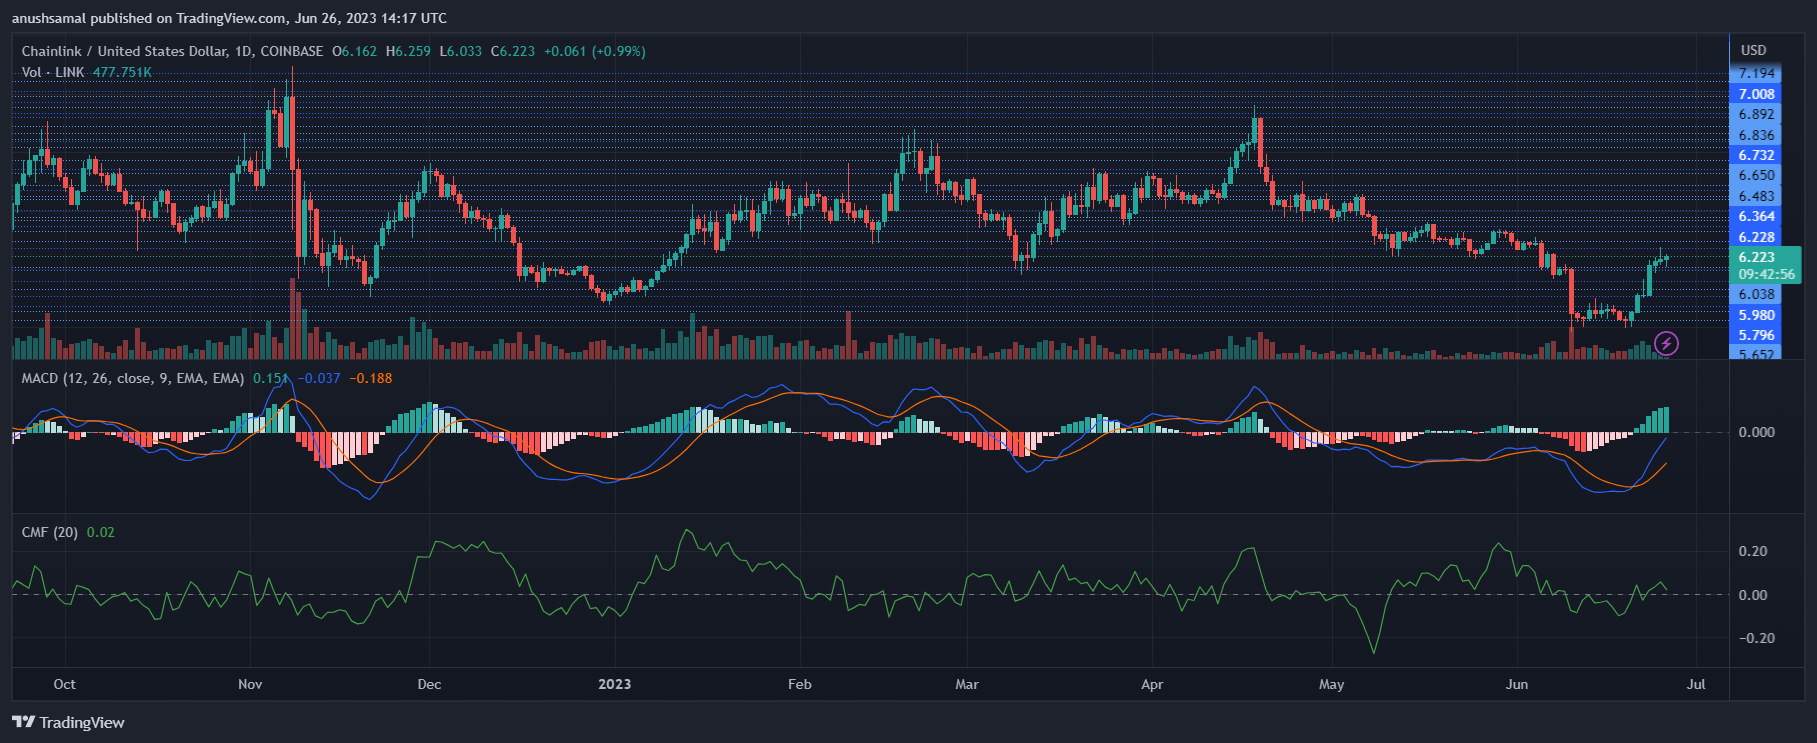
The daily chart for LINK has shown buy signals in line with the increasing demand. The Moving Average Convergence Divergence (MACD) indicator has displayed tall and growing green histograms, which are typically associated with buy signals. This suggests a positive momentum for the altcoin.
However, it is important to note that the Chaikin Money Flow (CMF), which reflects capital inflows and outflows, has formed a downtick. While capital inflows still outweigh outflows, the rate of inflows has been declining at press time.
Featured image from DataDrivenInvestor, charts from TradingView.com
- SEO Powered Content & PR Distribution. Get Amplified Today.
- PlatoData.Network Vertical Generative Ai. Empower Yourself. Access Here.
- PlatoAiStream. Web3 Intelligence. Knowledge Amplified. Access Here.
- PlatoESG. Automotive / EVs, Carbon, CleanTech, Energy, Environment, Solar, Waste Management. Access Here.
- BlockOffsets. Modernizing Environmental Offset Ownership. Access Here.
- Source: https://www.newsbtc.com/news/chainlink/chainlink-bulls-must-defend-support-zone-to-prepare-for-another-rally/
- :has
- :is
- 000
- 20
- 46
- 60
- 70
- a
- above
- accumulation
- Action
- added
- also
- Altcoin
- Altcoins
- an
- analysis
- and
- Another
- anticipation
- ARE
- AS
- associated
- At
- average
- BE
- been
- below
- Bitcoin
- both
- Break
- broader
- Bullish
- Bulls
- buy
- buyers
- Buying
- by
- cannot
- capital
- capitalization
- causing
- Chainlink
- Changes
- Chart
- Charts
- Coins
- continue
- continued
- contributed
- Convergence
- could
- Current
- daily
- decision
- Decline
- Declining
- decrease
- Demand
- demonstrated
- Despite
- Dip
- displayed
- Divergence
- driven
- Dropping
- European
- Event
- expected
- experienced
- flow
- For
- formed
- from
- further
- Gain
- Gains
- Green
- Growing
- hand
- Have
- help
- HTTPS
- if
- image
- importance
- important
- improvement
- in
- Increase
- increased
- increasing
- index
- indicated
- indicating
- Indicator
- inflows
- influx
- into
- IT
- ITS
- largely
- Last
- lead
- Level
- levels
- Line
- LINK
- loss
- MACD
- maintain
- major
- manages
- mark
- Market
- Market Capitalization
- max-width
- Momentum
- money
- movement
- moving
- moving average
- must
- NewsBTC
- notable
- notably
- note
- of
- on
- ongoing
- Optimism
- Other
- out
- outflows
- Outlook
- outweigh
- over
- overall
- past
- plato
- Plato Data Intelligence
- PlatoData
- positive
- potential
- potentially
- power
- Prepare
- press
- prevent
- price
- PRICE ACTION
- Price Analysis
- price rally
- privacy
- Privacy coins
- pullback
- Push
- rally
- Rate
- Reading
- reflects
- relative
- relative strength index
- Relative Strength Index (RSI)
- remained
- remove
- representing
- Resistance
- resulting
- rsi
- ruled
- sentiment
- session
- sessions
- several
- should
- shown
- signals
- significant
- Source
- stable
- Still
- strength
- Suggests
- support
- support level
- support levels
- surge
- surpassed
- Technical
- that
- The
- There.
- this
- time
- to
- toward
- Trading
- Trading sessions
- trading volume
- TradingView
- Turned
- typically
- upcoming
- upward
- volume
- was
- Watch
- week
- which
- while
- will
- with
- witnessed
- would
- zephyrnet