One simple trading strategy that does tend to work very effectively is trading a trend continuation pattern, which is the flag or pennant pattern. These patterns tend to recur again and again on any price chart and on any timeframe. This strategy provides a structure for traders to easily identify flag and pennant patterns.
Flag and Pennant Patterns
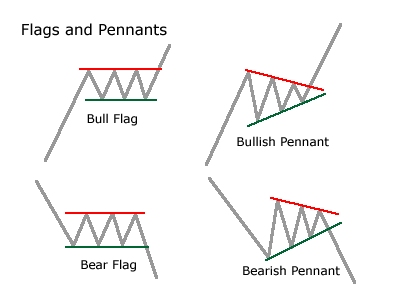
Flag and pennant patterns are two of the most effective trend continuation price patterns. These two patterns are very similar with a few differences.
Flag patterns begin with a strong momentum push. A bullish flag pattern begins with a bullish momentum rally, while a bearish flag pattern begins with a bearish momentum drop. This initial momentum forms the “pole” of the flag. As the initial momentum phase fizzles out, price tends to congest and pull back.
This is because many of those who made money in the initial momentum phase would start to close their positions. This slow pullback or retracement forms the body of the flag. However, this is usually just a temporary market contraction phase, which is somewhat of a rest for the market.
Then, as volume and volatility start to pick up, price would break out of the tight market contraction which is the body of the flag. The breakout is also usually in the direction of the initial momentum phase. This breakout is the signal of the next momentum breakout which is the continuation signal.
The pennant pattern is also very similar to the flag pattern. It also follows the cycle of an initial momentum rally or drop, which forms the pole of the pennant. Then it is followed by a market contraction phase or pullback which forms the body of the pennant. However, this pullback or retracement is characterized by a tightening body.
This tells us that the volume traded is gradually getting smaller, which means there is a pent-up volume for the breakout. Just as with the flag pattern, the breakout on the resumption of the market expansion phase is also usually in the direction of the initial momentum direction.
Below is a chart showing what flag and pennant patterns should look like.

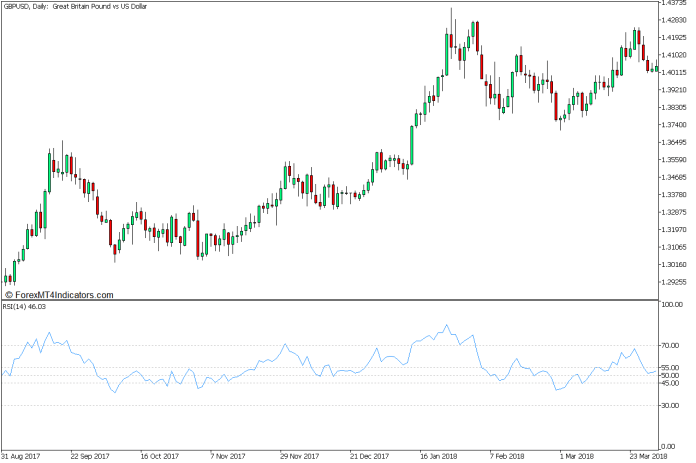
Relative Strength Index
The Relative Strength Index (RSI) is a very versatile momentum indicator. It can be used to identify overbought and oversold markets, as well as trends and trend direction.
The RSI plots a line that oscillates within the range of zero to 100. This line typically mirrors the movements of price action on its indicator window.
The range of the RSI also has markers at levels 30 and 70. An RSI line dropping below 30 indicates an oversold market, while an RSI line breaching above 70 indicates an overbought market. Both scenarios have a very high probability of developing into a mean reversal. This is typically the most popular usage of the RSI.
However, the RSI can also be used to identify trends and trend direction. To do this, we would need to add levels 45, 50, and 55.
The RSI line tends to stay above 50 in an uptrend market with level 45 acting as support for the RSI line. In this scenario, a break above 55 could indicate the resumption of the trend or momentum.
Inversely, the RSI line also tends to stay below 50 in a downtrend while 55 acts as a resistance for the RSI line. In this scenario, a drop below 45 could indicate a resumption of the trend or momentum.

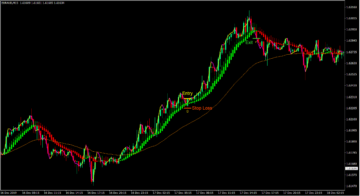
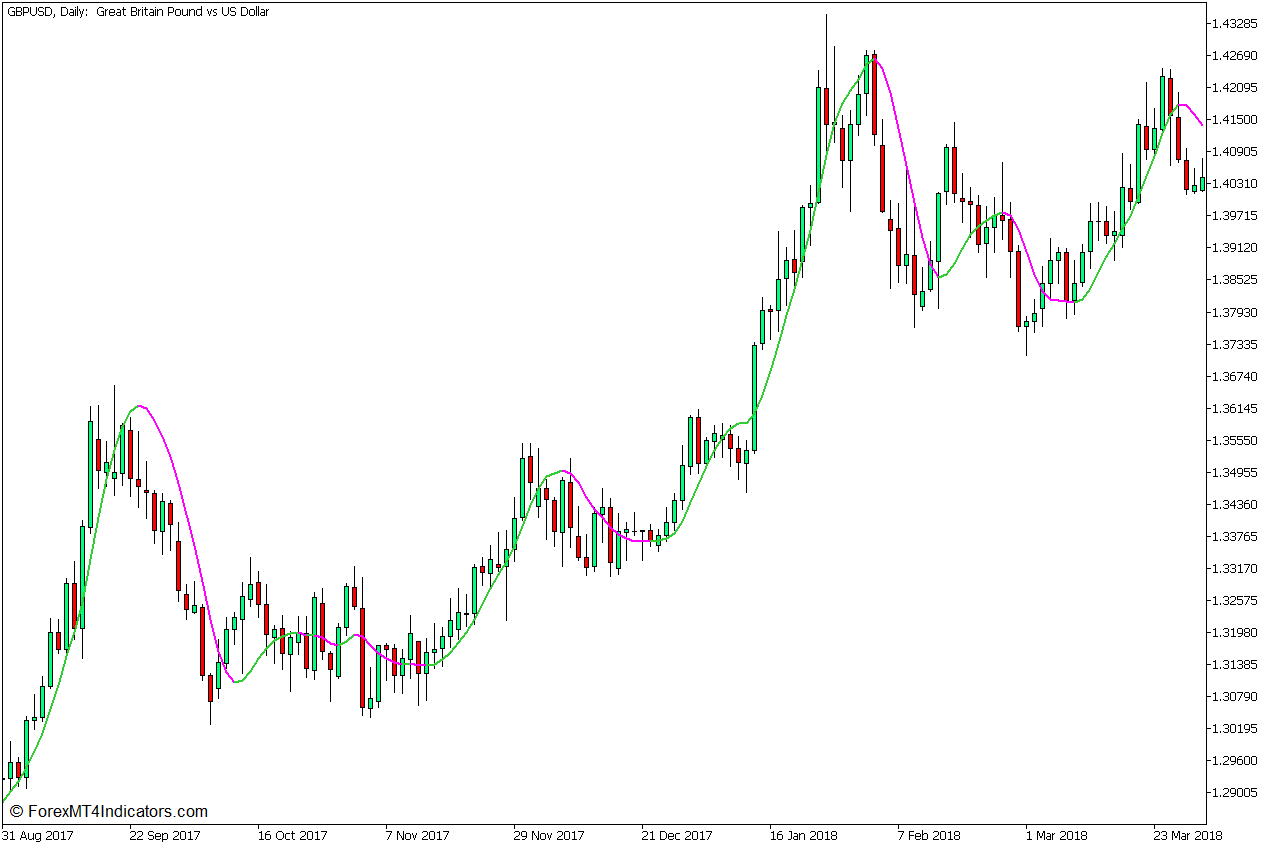
Hull Moving Average
The Hull Moving Average (HMA) is a trend-following technical indicator that was developed by Allan Hull in 2005.
The HMA was developed to produce a moving average line that carries the least lag as possible yet still plots a smooth moving average line. This dynamic sets a good balance between a responsive trade signal which allows traders to enter trades earlier and a decently accurate signal which waits for a confirmed trend or momentum reversal.
This preset of the Hull Moving Average modifies the color of the HMA line based on the slope of the line. It plots a lime green line whenever the line is in an upward slope and a magenta line whenever the line is in a downward slope. The color of the line can be used as a momentum direction indication. The changing of the color of the line can also be used as a reversal trade entry signal.

Trading Strategy Concept
This trading strategy is a trend continuation strategy that incorporates the flag and pennant patterns, the RSI, and the HMA line.
Users should first observe the price chart for a strong price pulse and a pullback which should form a flag or pennant pattern.
The RSI line is used to confirm if the trend or momentum is still in place based on the mentum is still in place based on the 45 and 55 support and resistance.
The HMA line is then used to confirm the trade entry based on the changing of the color of its line.
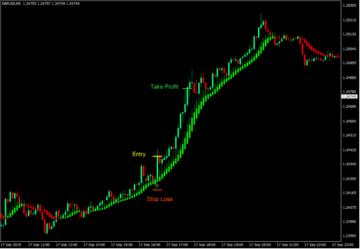
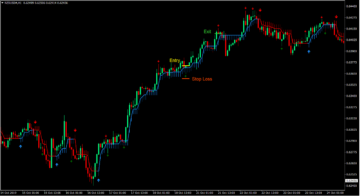
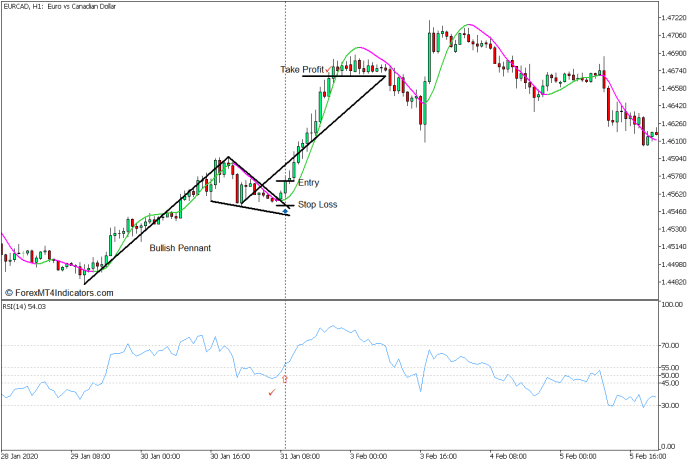
Buy Trade Setup
Entry
- A strong momentum rally should be observable.
- The RSI line should stay above 45.
- Price should pull back forming a bullish flag or pennant pattern.
- Price should break above the body of the flag or pennant pattern.
- The RSI line should break above 55.
- The HMA line should change to lime green.
- Enter a buy order on the confluence of these signals.
Stop Loss
- Set the stop loss on the support below the entry candle.
Exit
- Set the take profit target at the same distance as the pole of the flag or pennant coming from the lower base of its body.

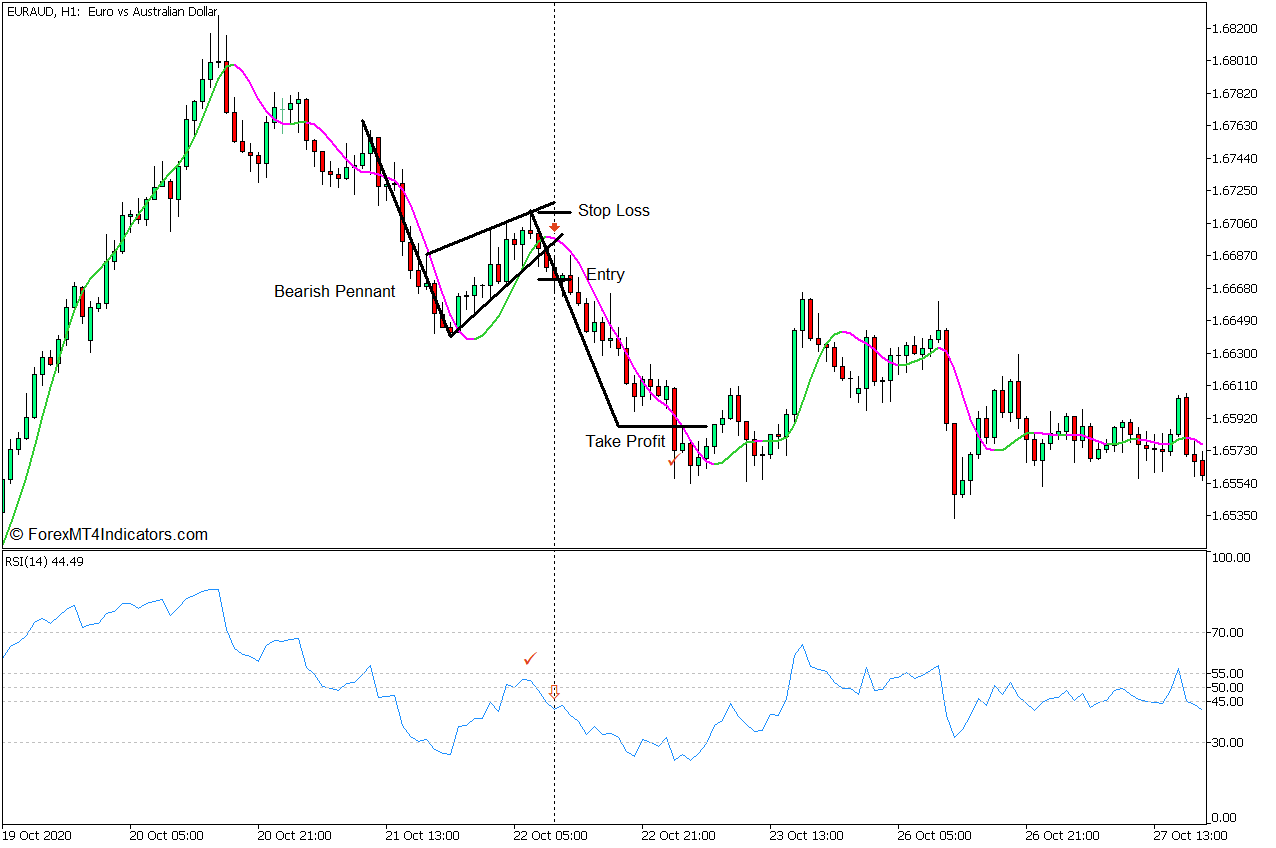
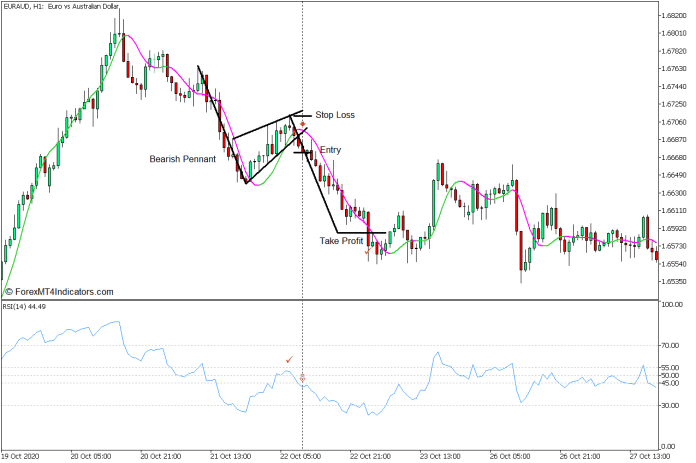
Sell Trade Setup
Entry
- A strong momentum drop should be observable.
- The RSI line should stay below 55.
- Price should pull back forming a bearish flag or pennant pattern.
- The price should break below the body of the flag or pennant pattern.
- The RSI line should drop below 45.
- The HMA line should change to magenta.
- Enter a sell order on the confluence of these signals.
Stop Loss
- Set the stop loss on the resistance above the entry candle.
Exit
- Set the take profit target at the same distance as the pole of the flag or pennant coming from the upper base of its body.
Conclusion
Flag and pennant patterns can be very effective continuation price patterns to trade. But it also requires skill and practice to spot these patterns and time their breakouts.
This strategy allows traders to identify these patterns more easily and objectively confirm the breakouts based on momentum.
Recommended MT5 Broker
- Free $50 To Start Trading Instantly! (Withdrawable Profit)
- Deposit Bonus up to $5,000
- Unlimited Loyalty Program
- Award Winning Forex Broker
- Additional Exclusive Bonuses Throughout The Year

>> Claim Your $50 Bonus Here <<
Click here below to download:
Save
Save
- SEO Powered Content & PR Distribution. Get Amplified Today.
- PlatoData.Network Vertical Generative Ai. Empower Yourself. Access Here.
- PlatoAiStream. Web3 Intelligence. Knowledge Amplified. Access Here.
- PlatoESG. Carbon, CleanTech, Energy, Environment, Solar, Waste Management. Access Here.
- PlatoHealth. Biotech and Clinical Trials Intelligence. Access Here.
- Source: https://www.forexmt4indicators.com/colored-hull-moving-average-flag-forex-trading-strategy-for-mt5/?utm_source=rss&utm_medium=rss&utm_campaign=colored-hull-moving-average-flag-forex-trading-strategy-for-mt5
- :has
- :is
- $UP
- 100
- 2005
- 30
- 300
- 400
- 45
- 50
- 55
- 70
- a
- above
- accurate
- acting
- Action
- acts
- add
- again
- allows
- also
- an
- and
- any
- ARE
- AS
- At
- average
- back
- Balance
- base
- based
- BE
- bearish
- Bearish Momentum
- because
- begin
- begins
- below
- between
- body
- Bonus
- both
- Break
- break out
- breakout
- breakouts
- Bullish
- but
- buy
- by
- CAN
- change
- changing
- characterized
- Chart
- claim
- Close
- color
- coming
- Confirm
- CONFIRMED
- confluence
- continuation
- contraction
- could
- cycle
- developed
- developing
- differences
- direction
- distance
- do
- does
- download
- downward
- Drop
- Dropping
- dynamic
- Earlier
- easily
- Effective
- effectively
- Enter
- entry
- Exclusive
- expansion
- few
- First
- followed
- follows
- For
- forex
- Forex Trading
- form
- forming
- forms
- from
- getting
- good
- gradually
- Green
- Have
- here
- High
- However
- HTTPS
- identify
- if
- in
- incorporates
- index
- indicate
- indicates
- indication
- Indicator
- initial
- into
- IT
- ITS
- just
- least
- Level
- levels
- like
- Lime
- Line
- Look
- look like
- loss
- lower
- Loyalty
- made
- many
- Market
- Markets
- max-width
- mean
- means
- Momentum
- money
- more
- most
- Most Popular
- movements
- moving
- moving average
- Need
- next
- objectively
- observe
- of
- on
- or
- order
- out
- Pattern
- patterns
- phase
- PHP
- pick
- Place
- plato
- Plato Data Intelligence
- PlatoData
- Popular
- positions
- possible
- practice
- price
- PRICE ACTION
- price chart
- probability
- produce
- Profit
- provides
- pullback
- pulse
- Push
- rally
- range
- relative
- relative strength index
- Relative Strength Index (RSI)
- requires
- Resistance
- responsive
- REST
- retracement
- Reversal
- rsi
- same
- scenario
- scenarios
- sell
- Sets
- should
- showing
- Signal
- signals
- similar
- Simple
- skill
- Slope
- slow
- smaller
- smooth
- somewhat
- Spot
- start
- stay
- Still
- Stop
- Strategy
- strength
- strong
- structure
- support
- Take
- Target
- Technical
- tells
- temporary
- tend
- tends
- that
- The
- their
- then
- There.
- These
- this
- those
- throughout
- tightening
- time
- timeframe
- to
- trade
- traded
- Traders
- trades
- Trading
- trading strategy
- Trend
- Trends
- two
- typically
- uptrend
- upward
- us
- Usage
- used
- usually
- versatile
- very
- Volatility
- volume
- waits
- was
- we
- WELL
- What
- whenever
- which
- while
- WHO
- window
- winning
- with
- within
- Work
- would
- yet
- Your
- zephyrnet
- zero