With the use of cloud computing, big data and machine learning (ML) tools like Amazon Athena or Amazon SageMaker have become available and useable by anyone without much effort in creation and maintenance. Industrial companies increasingly look at data analytics and data-driven decision-making to increase resource efficiency across their entire portfolio, from operations to performing predictive maintenance or planning.
Due to the velocity of change in IT, customers in traditional industries are facing a dilemma of skillset. On the one hand, analysts and domain experts have a very deep knowledge of the data in question and its interpretation, yet often lack the exposure to data science tooling and high-level programming languages such as Python. On the other hand, data science experts often lack the experience to interpret the machine data content and filter it for what is relevant. This dilemma hampers the creation of efficient models that use data to generate business-relevant insights.
Amazon SageMaker Canvas addresses this dilemma by providing domain experts a no-code interface to create powerful analytics and ML models, such as forecasts, classification, or regression models. It also allows you to deploy and share these models with ML and MLOps specialists after creation.
In this post, we show you how to use SageMaker Canvas to curate and select the right features in your data, and then train a prediction model for anomaly detection, using the no-code functionality of SageMaker Canvas for model tuning.
Anomaly detection for the manufacturing industry
At the time of writing, SageMaker Canvas focuses on typical business use cases, such as forecasting, regression, and classification. For this post, we demonstrate how these capabilities can also help detect complex abnormal data points. This use case is relevant, for instance, to pinpoint malfunctions or unusual operations of industrial machines.
Anomaly detection is important in the industry domain, because machines (from trains to turbines) are normally very reliable, with times between failures spanning years. Most data from these machines, such as temperature senor readings or status messages, describes the normal operation and has limited value for decision-making. Engineers look for abnormal data when investigating root causes for a fault or as warning indicators for future faults, and performance managers examine abnormal data to identify potential improvements. Therefore, the typical first step in moving towards data-driven decision-making relies on finding that relevant (abnormal) data.
In this post, we use SageMaker Canvas to curate and select the right features in data, and then train a prediction model for anomaly detection, using SageMaker Canvas no-code functionality for model tuning. Then we deploy the model as a SageMaker endpoint.
Solution overview
For our anomaly detection use case, we train a prediction model to predict a characteristic feature for the normal operation of a machine, such as the motor temperature indicated in a car, from influencing features, such as the speed and recent torque applied in the car. For anomaly detection on a new sample of measurements, we compare the model predictions for the characteristic feature with the observations provided.
For the example of the car motor, a domain expert obtains measurements of the normal motor temperature, recent motor torque, ambient temperature, and other potential influencing factors. These allow you to train a model to predict the temperature from the other features. Then we can use the model to predict the motor temperature on a regular basis. When the predicted temperature for that data is similar to the observed temperature in that data, the motor is working normally; a discrepancy will point to an anomaly, such as the cooling system failing or a defect in the motor.
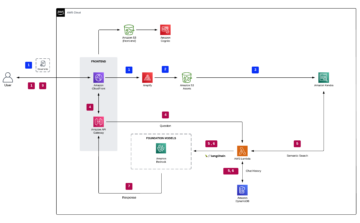
The following diagram illustrates the solution architecture.
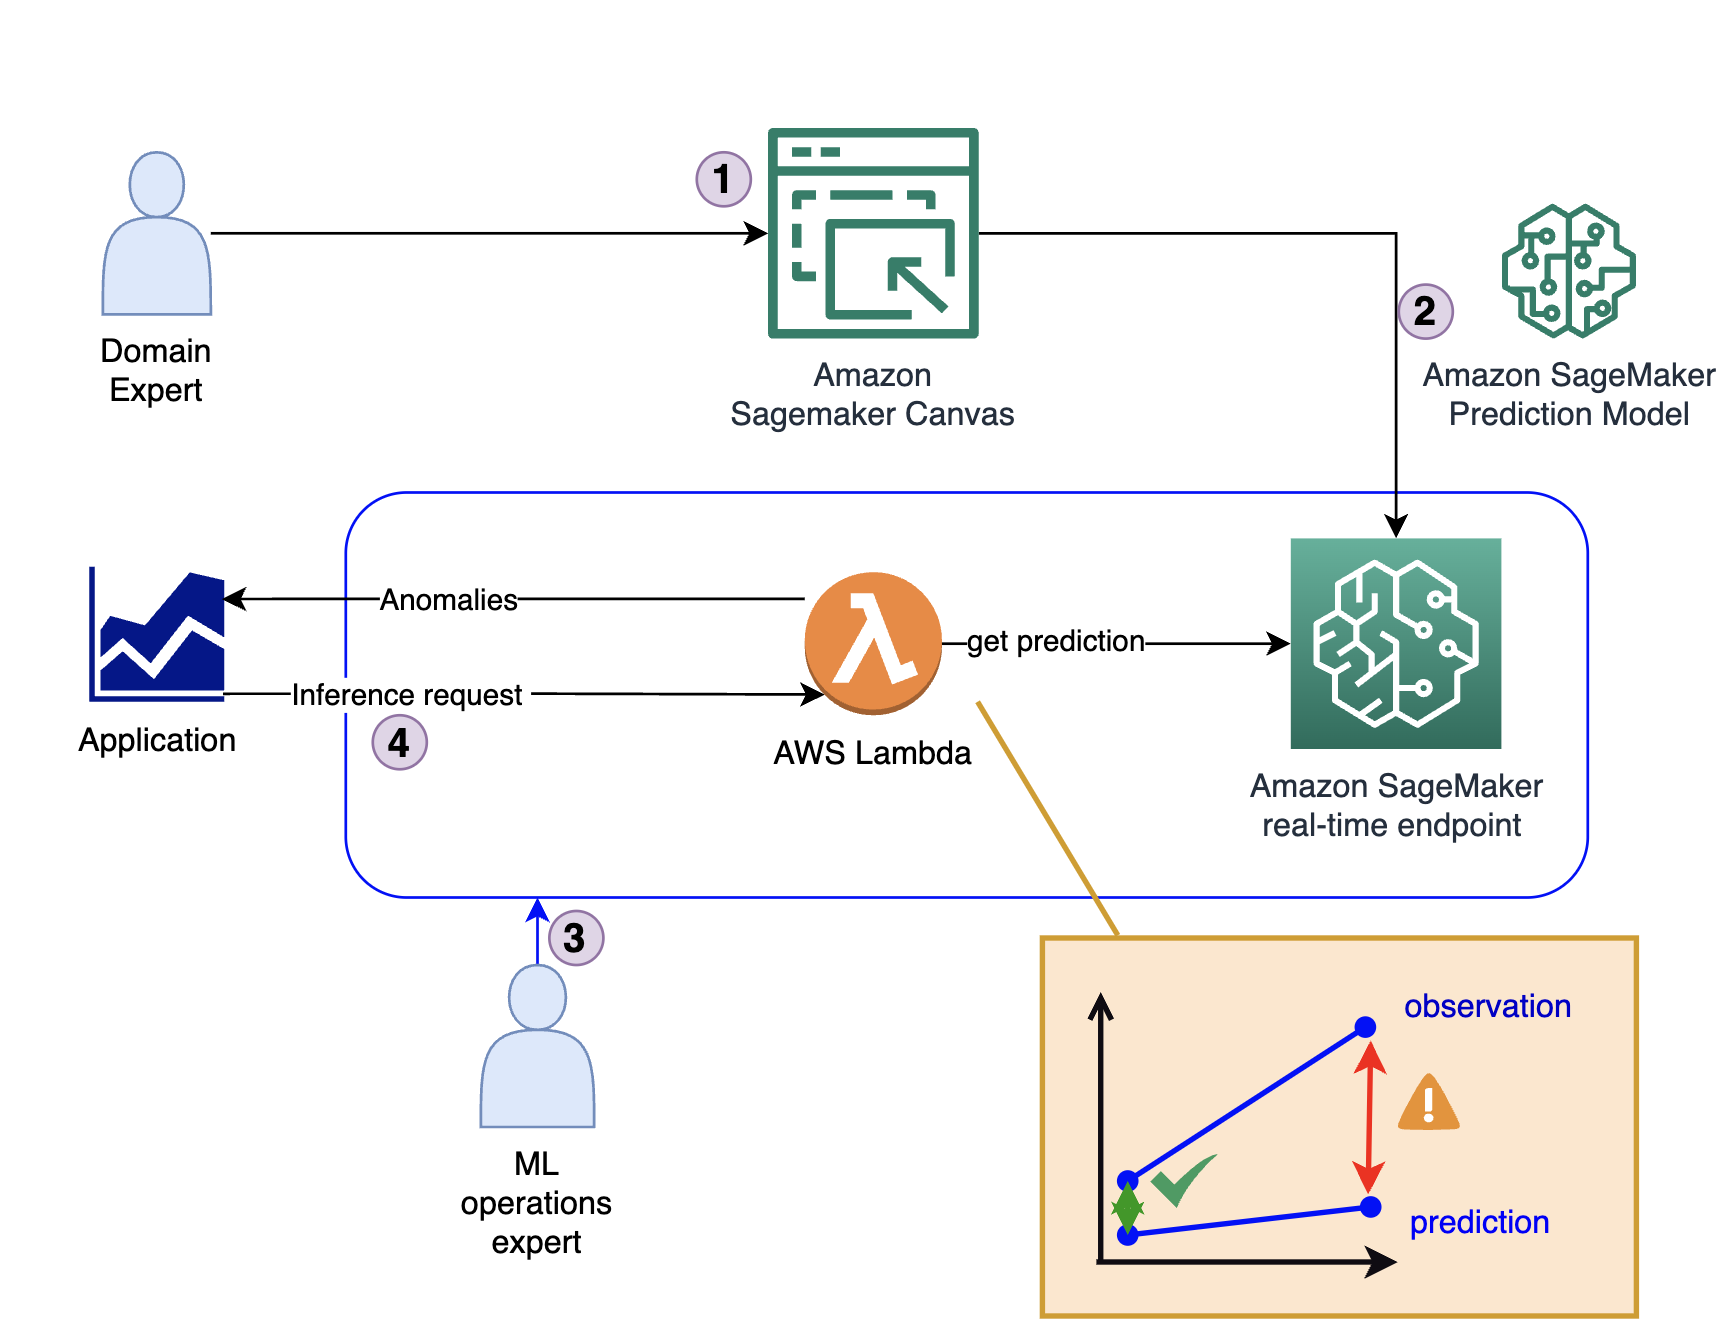
The solution consists of four key steps:
- The domain expert creates the initial model, including data analysis and feature curation using SageMaker Canvas.
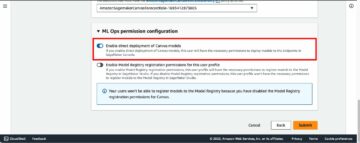
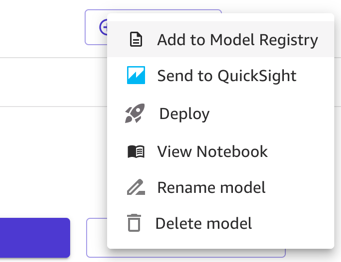
- The domain expert shares the model via the Amazon SageMaker Model Registry or deploys it directly as a real-time endpoint.
- An MLOps expert creates the inference infrastructure and code translating the model output from a prediction into an anomaly indicator. This code typically runs inside an AWS Lambda function.
- When an application requires an anomaly detection, it calls the Lambda function, which uses the model for inference and provides the response (whether or not it’s an anomaly).
Prerequisites
To follow along with this post, you must meet the following prerequisites:
Create the model using SageMaker
The model creation process follows the standard steps to create a regression model in SageMaker Canvas. For more information, refer to Getting started with using Amazon SageMaker Canvas.
First, the domain expert loads relevant data into SageMaker Canvas, such as a time series of measurements. For this post, we use a CSV file containing the (synthetically generated) measurements of an electrical motor. For details, refer to Import data into Canvas. The sample data used is available for download as a CSV.
Curate the data with SageMaker Canvas
After the data is loaded, the domain expert can use SageMaker Canvas to curate the data used in the final model. For this, the expert selects those columns that contain characteristic measurements for the problem in question. More precisely, the expert selects columns that are related to each other, for instance, by a physical relationship such as a pressure-temperature curve, and where a change in that relationship is a relevant anomaly for their use case. The anomaly detection model will learn the normal relationship between the selected columns and indicate when data doesn’t conform to it, such as an abnormally high motor temperature given the current load on the motor.
In practice, the domain expert needs to select a set of suitable input columns and a target column. The inputs are typically the collection of quantities (numeric or categorical) that determine a machine’s behavior, from demand settings, to load, speed, or ambient temperature. The output is typically a numeric quantity that indicates the performance of the machine’s operation, such as a temperature measuring energy dissipation or another performance metric changing when the machine runs under suboptimal conditions.
To illustrate the concept of what quantities to select for input and output, let’s consider a few examples:
- For rotating equipment, such as the model we build in this post, typical inputs are the rotation speed, torque (current and history), and ambient temperature, and the targets are the resulting bearing or motor temperatures indicating good operational conditions of the rotations
- For a wind turbine, typical inputs are the current and recent history of wind speed and rotor blade settings, and the target quantity is the produced power or rotational speed
- For a chemical process, typical inputs are the percentage of different ingredients and the ambient temperature, and targets are the heat produced or the viscosity of the end product
- For moving equipment such as sliding doors, typical inputs are the power input to the motors, and the target value is the speed or completion time for the movement
- For an HVAC system, typical inputs are the achieved temperature difference and load settings, and the target quantity is the energy consumption measured
Ultimately, the right inputs and targets for a given equipment will depend on the use case and anomalous behavior to detect, and are best known to a domain expert who is familiar with the intricacies of the specific dataset.
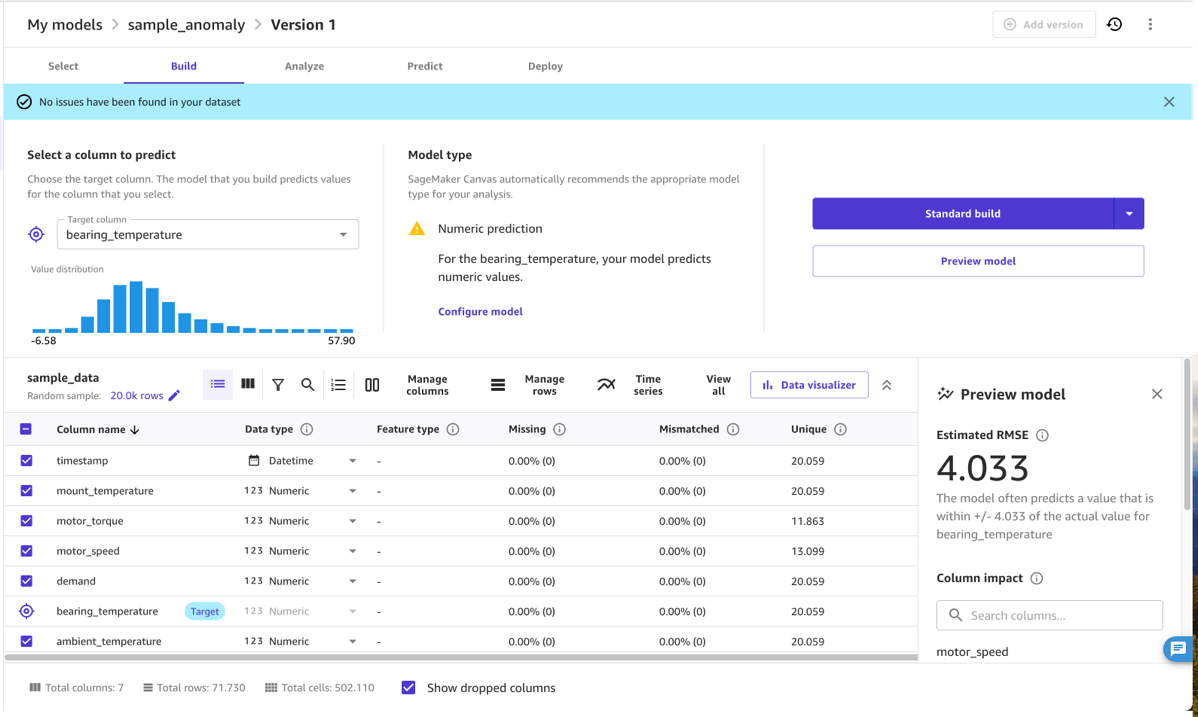
In most cases, selecting suitable input and target quantities means selecting the right columns only and marking the target column (for this example, bearing_temperature). However, a domain expert can also use the no-code features of SageMaker Canvas to transform columns and refine or aggregate the data. For instance, you can extract or filter specific dates or timestamps from the data that are not relevant. SageMaker Canvas supports this process, showing statistics on the quantities selected, allowing you to understand if a quantity has outliers and spread that may affect the results of the model.
Train, tune, and evaluate the model
After the domain expert has selected suitable columns in the dataset, they can train the model to learn the relationship between the inputs and outputs. More precisely, the model will learn to predict the target value selected from the inputs.
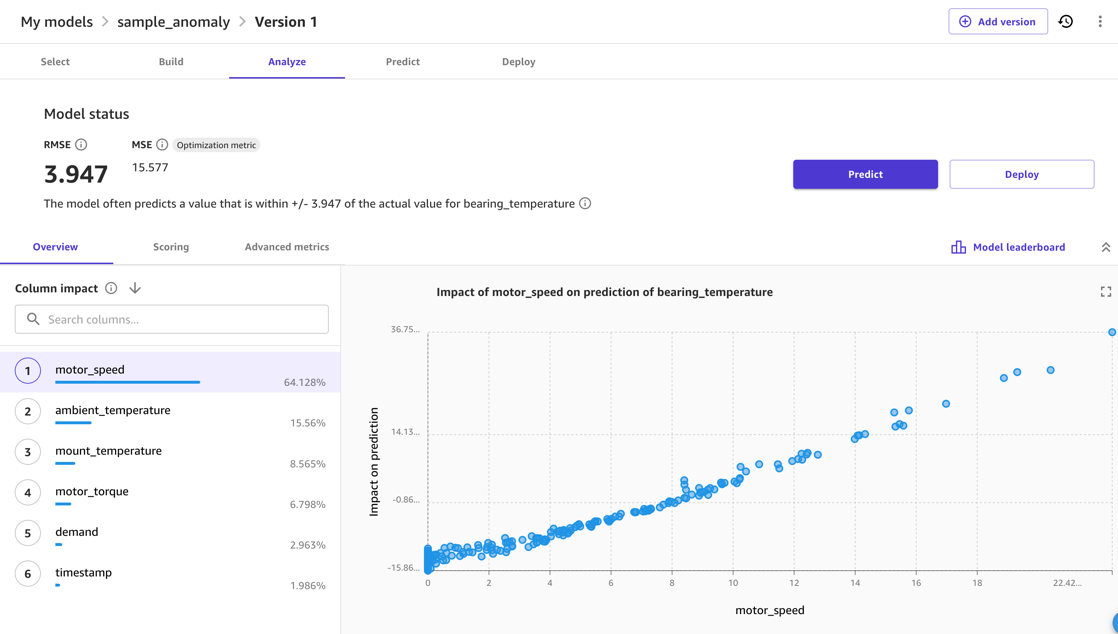
Normally, you can use the SageMaker Canvas Model Preview option. This provide a quick indication of the model quality to expect, and allows you to investigate the effect that different inputs have on the output metric. For instance, in the following screenshot, the model is most affected by the motor_speed and ambient_temperature metrics when predicting bearing_temperature. This is sensible, because these temperatures are closely related. At the same time, additional friction or other means of energy loss are likely to affect this.
For the model quality, the RMSE of the model is an indicator how well the model was able to learn the normal behavior in the training data and reproduce the relationships between the input and output measures. For instance, in the following model, the model should be able to predict the correct motor_bearing temperature within 3.67 degrees Celsius, so we can consider a deviation of the real temperature from a model prediction that is larger than, for example, 7.4 degrees as an anomaly. The real threshold that you would use, however, will depend on the sensitivity required in the deployment scenario.
Finally, after the model evaluation and tuning is finished, you can start the complete model training that will create the model to use for inference.
Deploy the model
Although SageMaker Canvas can use a model for inference, productive deployment for anomaly detection requires you to deploy the model outside of SageMaker Canvas. More precisely, we need to deploy the model as an endpoint.
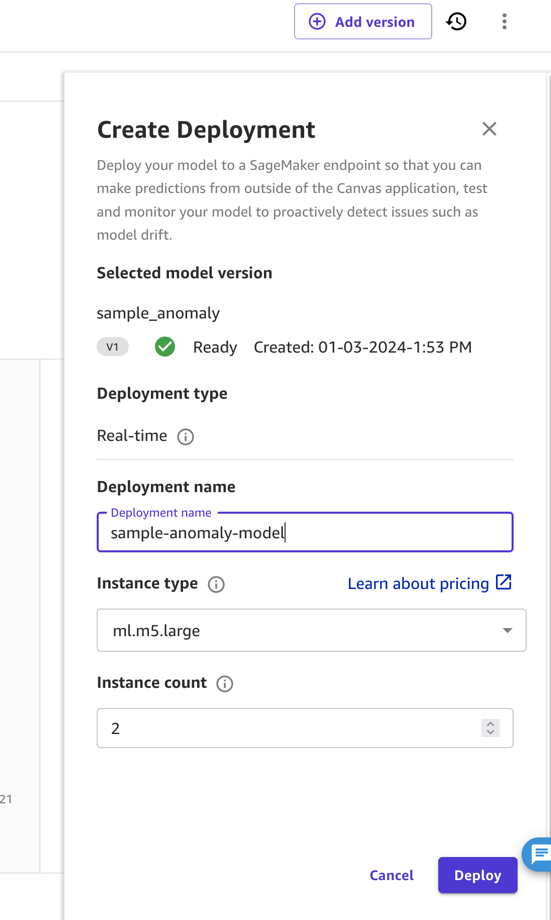
In this post and for simplicity, we deploy the model as an endpoint from SageMaker Canvas directly. For instructions, refer to Deploy your models to an endpoint. Make sure to take note of the deployment name and consider the pricing of the instance type you deploy to (for this post, we use ml.m5.large). SageMaker Canvas will then create a model endpoint that can be called to obtain predictions.
In industrial settings, a model needs to undergo thorough testing before it can be deployed. For this, the domain expert will not deploy it, but instead share the model to the SageMaker Model Registry. Here, an MLOps operations expert can take over. Typically, that expert will test the model endpoint, evaluate the size of computing equipment required for the target application, and determine most cost-efficient deployment, such as deployment for serverless inference or batch inference. These steps are normally automated (for instance, using Amazon Sagemaker Pipelines or the Amazon SDK).
Use the model for anomaly detection
In the previous step, we created a model deployment in SageMaker Canvas, called canvas-sample-anomaly-model. We can use it to obtain predictions of a bearing_temperature value based on the other columns in the dataset. Now, we want to use this endpoint to detect anomalies.
To identify anomalous data, our model will use the prediction model endpoint to get the expected value of the target metric and then compare the predicted value against the actual value in the data. The predicted value indicates the expected value for our target metric based on the training data. The difference of this value therefore is a metric for the abnormality of the actual data observed. We can use the following code:
The preceding code performs the following actions:
- The input data is filtered down to the right features (function “
input_transformer“). - The SageMaker model endpoint is invoked with the filtered data (function “
do_inference“), where we handle input and output formatting according to the sample code provided when opening the details page of our deployment in SageMaker Canvas. - The result of the invocation is joined to the original input data and the difference is stored in the error column (function “
output_transform“).
Find anomalies and evaluate anomalous events
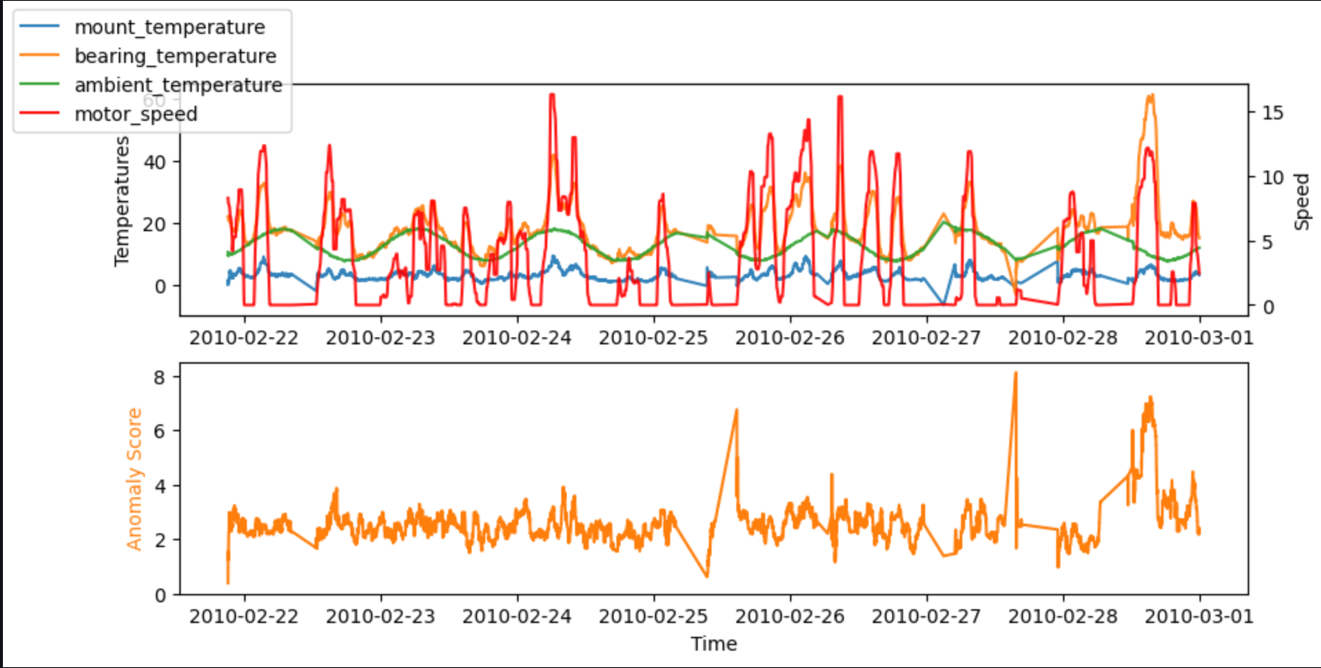
In a typical setup, the code to obtain anomalies is run in a Lambda function. The Lambda function can be called from an application or Amazon API Gateway. The main function returns an anomaly score for each row of the input data—in this case, a time series of an anomaly score.
For testing, we can also run the code in a SageMaker notebook. The following graphs show the inputs and output of our model when using the sample data. Peaks in the deviation between predicted and actual values (anomaly score, shown in the lower graph) indicate anomalies. For instance, in the graph, we can see three distinct peaks where the anomaly score (difference between expected and real temperature) surpasses 7 degrees Celsius: the first after a long idle time, the second at a steep drop of bearing_temperature, and the last where bearing_temperature is high compared to motor_speed.
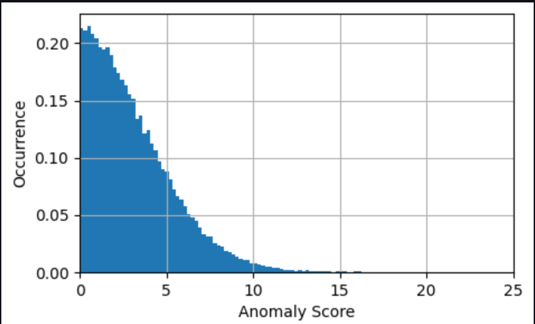
In many cases, knowing the time series of the anomaly score is already sufficient; you can set up a threshold for when to warn of a significant anomaly based on the need for model sensitivity. The current score then indicates that a machine has an abnormal state that needs investigation. For instance, for our model, the absolute value of the anomaly score is distributed as shown in the following graph. This confirms that most anomaly scores are below the (2xRMS=)8 degrees found during training for the model as the typical error. The graph can help you choose a threshold manually, such that the right percentage of the evaluated samples are marked as anomalies.
If the desired output are events of anomalies, then the anomaly scores provided by the model require refinement to be relevant for business use. For this, the ML expert will typically add postprocessing to remove noise or large peaks on the anomaly score, such as adding a rolling mean. In addition, the expert will typically evaluate the anomaly score by a logic similar to raising an Amazon CloudWatch alarm, such as monitoring for the breach of a threshold over a specific duration. For more information about setting up alarms, refer to Using Amazon CloudWatch alarms. Running these evaluations in the Lambda function allows you to send warnings, for instance, by publishing a warning to an Amazon Simple Notification Service (Amazon SNS) topic.
Clean up
After you have finished using this solution, you should clean up to avoid unnecessary cost:
- In SageMaker Canvas, find your model endpoint deployment and delete it.
- Log out of SageMaker Canvas to avoid charges for it running idly.
Summary
In this post, we showed how a domain expert can evaluate input data and create an ML model using SageMaker Canvas without the need to write code. Then we showed how to use this model to perform real-time anomaly detection using SageMaker and Lambda through a simple workflow. This combination empowers domain experts to use their knowledge to create powerful ML models without additional training in data science, and enables MLOps experts to use these models and make them available for inference flexibly and efficiently.
A 2-month free tier is available for SageMaker Canvas, and afterwards you only pay for what you use. Start experimenting today and add ML to make the most of your data.
About the author
 Helge Aufderheide is an enthusiast of making data usable in the real world with a strong focus on Automation, Analytics and Machine Learning in Industrial Applications, such as Manufacturing and Mobility.
- SEO Powered Content & PR Distribution. Get Amplified Today.
- PlatoData.Network Vertical Generative Ai. Empower Yourself. Access Here.
- PlatoAiStream. Web3 Intelligence. Knowledge Amplified. Access Here.
- PlatoESG. Carbon, CleanTech, Energy, Environment, Solar, Waste Management. Access Here.
- PlatoHealth. Biotech and Clinical Trials Intelligence. Access Here.
- Source: https://aws.amazon.com/blogs/machine-learning/detect-anomalies-in-manufacturing-data-using-amazon-sagemaker-canvas/
- :has
- :is
- :not
- :where
- $UP
- 100
- 25
- 4
- 67
- 7
- a
- Able
- abnormal
- abnormality
- About
- Absolute
- Accept
- accessed
- According
- achieved
- across
- actions
- actual
- add
- adding
- addition
- Additional
- addresses
- affect
- affected
- After
- afterwards
- against
- aggregate
- alarm
- allow
- Allowing
- allows
- along
- already
- also
- Amazon
- Amazon SageMaker
- Amazon SageMaker Canvas
- Amazon Web Services
- Ambient
- an
- analysis
- Analysts
- analytics
- and
- anomaly detection
- Another
- anyone
- api
- Application
- applications
- applied
- architecture
- ARE
- AS
- At
- Automated
- Automation
- available
- avoid
- AWS
- AWS Lambda
- Axis
- based
- basis
- BE
- because
- become
- before
- behavior
- below
- Benchmark
- BEST
- between
- Big
- Big Data
- BLADE
- body
- breach
- build
- business
- but
- button
- by
- called
- Calls
- CAN
- canvas
- capabilities
- car
- case
- cases
- causes
- Celsius
- change
- changing
- characteristic
- charges
- chemical
- Choose
- classification
- clean
- closely
- Cloud
- cloud computing
- code
- collection
- Column
- Columns
- combination
- Companies
- compare
- compared
- complete
- completion
- complex
- computing
- concept
- conditions
- Configuration
- Consider
- consists
- consumption
- contain
- content
- cooling system
- correct
- Cost
- create
- created
- creates
- creation
- curate
- curation
- Current
- curve
- Customers
- data
- data analysis
- Data Analytics
- data points
- data science
- data-driven
- Dates
- Decision Making
- decreases
- deep
- def
- delete
- Demand
- demonstrate
- depend
- deploy
- deployed
- deployment
- deploys
- describes
- desired
- details
- detect
- Detection
- Determine
- deviation
- diagram
- difference
- different
- directly
- discrepancy
- distinct
- distributed
- Doesn’t
- domain
- doors
- down
- download
- Drop
- duration
- during
- each
- effect
- efficiency
- efficient
- efficiently
- effort
- empowers
- enables
- end
- Endpoint
- energy
- Energy Consumption
- Engineers
- enthusiast
- Entire
- equipment
- error
- Ether (ETH)
- evaluate
- evaluated
- evaluation
- evaluations
- events
- examine
- example
- examples
- expect
- expected
- experience
- experimenting
- expert
- experts
- Exposure
- extract
- facing
- factors
- failing
- failures
- familiar
- fault
- faults
- Feature
- Features
- few
- File
- filter
- final
- Find
- finding
- First
- flexibly
- Focus
- focuses
- follow
- following
- follows
- For
- forecasts
- found
- four
- Free
- friction
- from
- function
- functionality
- future
- generate
- generated
- get
- given
- good
- graph
- graphs
- hand
- handle
- Handling
- Have
- help
- here
- High
- high-level
- history
- How
- How To
- However
- HTML
- http
- HTTPS
- hvac
- HVAC system
- identify
- Idle
- if
- illustrate
- illustrates
- image
- import
- important
- improvements
- in
- Including
- Increase
- increasingly
- index
- indicate
- indicated
- indicates
- indicating
- indication
- Indicator
- Indicators
- industrial
- industries
- industry
- influencing
- information
- Infrastructure
- ingredients
- initial
- input
- inputs
- inside
- insights
- instance
- instead
- instructions
- Interface
- interpretation
- into
- intricacies
- investigate
- investigating
- investigation
- invoked
- IT
- ITS
- joined
- jpg
- json
- Key
- Knowing
- knowledge
- known
- Lack
- Languages
- large
- larger
- Last
- LEARN
- learning
- like
- likely
- Limited
- linear
- lines
- load
- loads
- logic
- Long
- Look
- loss
- lower
- machine
- machine learning
- Machines
- Main
- maintenance
- make
- Making
- malfunctions
- Managers
- manually
- manufacturing
- many
- marked
- marking
- May..
- mean
- means
- measurements
- measures
- measuring
- Meet
- messages
- metric
- Metrics
- ML
- MLOps
- mobility
- model
- models
- monitoring
- more
- most
- Motor
- Motors
- moving
- much
- must
- my
- name
- Need
- needs
- New
- Noise
- normal
- normally
- note
- notebook
- notification
- now
- observations
- observed
- obtain
- obtains
- occurrence
- of
- often
- on
- ONE
- only
- opening
- operation
- operational
- Operations
- Option
- or
- original
- Other
- our
- out
- output
- outputs
- outside
- over
- overview
- page
- pandas
- Pay
- percentage
- perform
- performance
- performing
- performs
- physical
- picture
- planning
- plato
- Plato Data Intelligence
- PlatoData
- Point
- points
- portfolio
- Post
- potential
- power
- powerful
- practice
- precisely
- predict
- predicted
- predicting
- prediction
- Predictions
- predictive
- Prepare
- prerequisites
- previous
- pricing
- Problem
- process
- Produced
- productive
- Programming
- programming languages
- provide
- provided
- provides
- providing
- Publishing
- Python
- quality
- quantity
- question
- Quick
- raising
- Read
- real
- real world
- real-time
- recent
- refer
- refine
- registry
- regression
- regular
- related
- relationship
- Relationships
- relevant
- reliable
- remove
- require
- required
- requires
- resource
- response
- result
- resulting
- Results
- return
- returns
- right
- Rolling
- root
- ROW
- Run
- running
- runs
- sagemaker
- same
- sample
- scenario
- Science
- score
- scores
- Second
- see
- select
- selected
- selecting
- send
- Sensitivity
- Series
- Serverless
- Services
- set
- setting
- settings
- setup
- Share
- Shares
- should
- show
- showed
- showing
- shown
- Shows
- significant
- similar
- Simple
- simplicity
- Size
- skillset
- sliding
- So
- solution
- some
- spanning
- specialists
- specific
- speed
- speeds
- spread
- standard
- start
- started
- State
- statistics
- Status
- Step
- Steps
- stored
- strong
- suboptimal
- such
- sufficient
- suitable
- Supports
- sure
- surpasses
- synthetically
- system
- Take
- Target
- targets
- test
- Testing
- than
- that
- The
- The Graph
- their
- Them
- then
- therefore
- These
- they
- this
- thorough
- those
- three
- threshold
- Through
- tier
- time
- Time Series
- times
- to
- today
- tools
- top
- topic
- towards
- traditional
- Train
- Training
- trains
- Transform
- tune
- tuning
- turbine
- two
- type
- typical
- typically
- under
- undergo
- understand
- unnecessary
- unusual
- usable
- use
- use case
- used
- uses
- using
- value
- Values
- VeloCity
- very
- via
- want
- warning
- was
- we
- web
- web services
- WELL
- What
- What is
- when
- whether
- which
- WHO
- will
- wind
- wind turbine
- window
- with
- within
- without
- workflow
- working
- world
- would
- write
- write code
- writing
- years
- yet
- you
- Your
- zephyrnet