Dogecoin (DOGE) has been following a descending resistance line since May 8.
Shiba Inu (SHIB) and Akita Inu (AKITA) have been decreasing since reaching all-time highs on May 10 and May 11, respectively.
DOGE
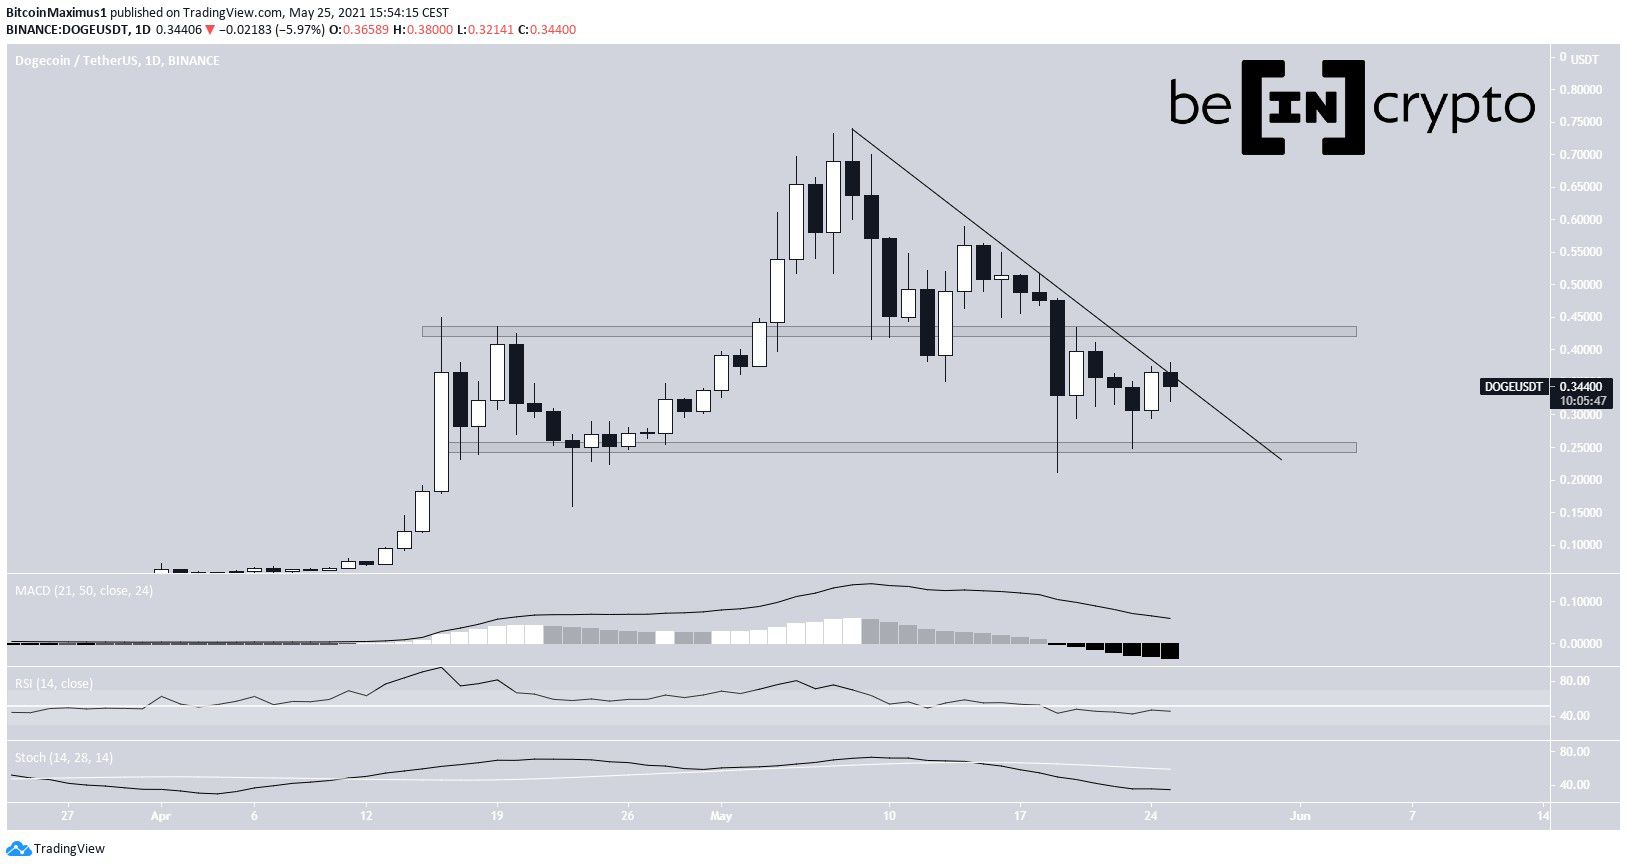
DOGE has been following a descending resistance line since reaching an all-time high price on May 8. Currently, it is in the process of making its fourth breakout attempt.
Previously, DOGE bounced twice at the $0.25 support area, doing so on May 19 and May 23. It is important to mention that the token created a higher low, instead of falling below the May 19 low.
Despite this, technical indicators are still bearish. This is especially evident by the RSI cross below 50. The main resistance area is found at $0.425.

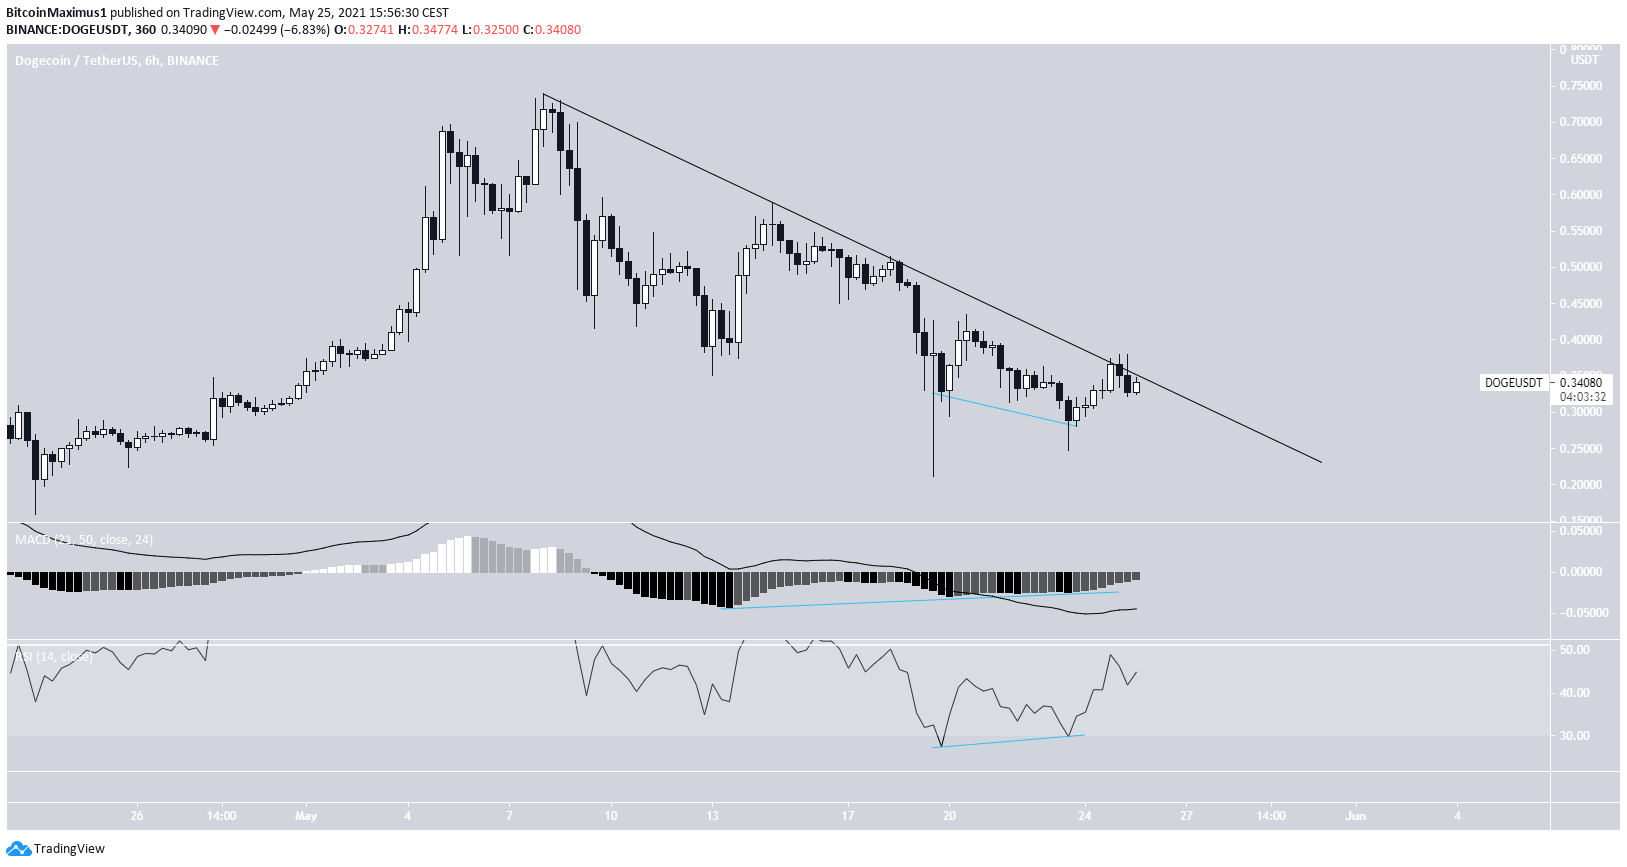
The shorter-term six-hour chart supports the possibility of a breakout. Both the MACD and RSI have generated considerable bullish divergence. The former has been doing so since May 13.
Therefore, a breakout from the resistance line is expected. However, until the $0.43 area is reclaimed, the trend cannot be considered bullish.
Highlights
- DOGE is following a descending resistance line.
- There is support and resistance at $0.25 and $0.43, respectively.
SHIB
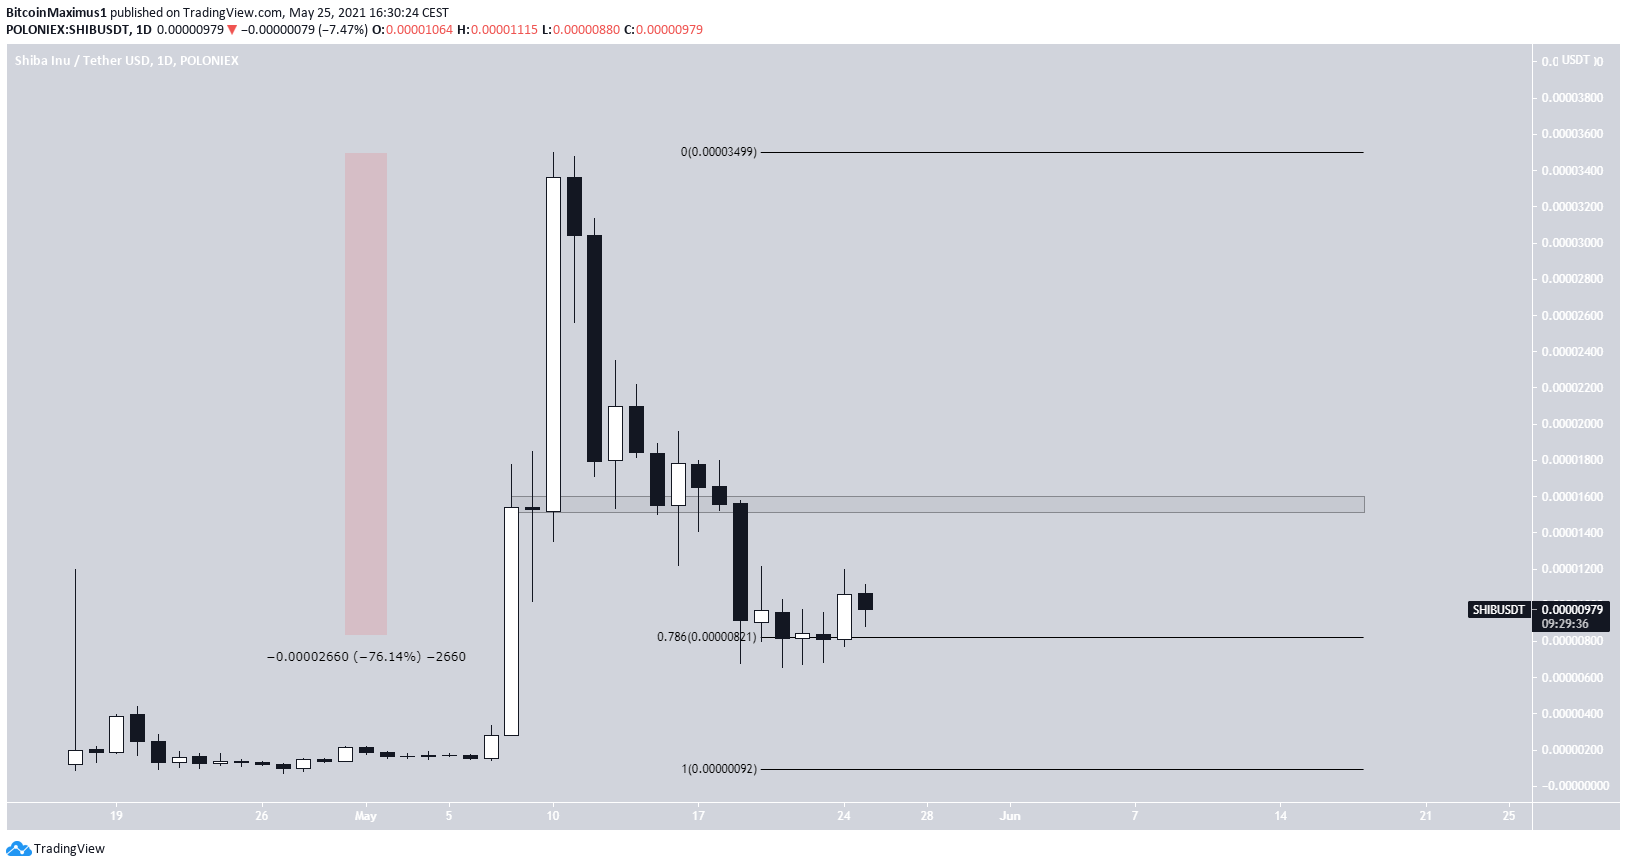
SHIB reached an all-time high price of $0.000035 on May 10. However, it has decreased considerably since, falling all the way to the 0.786 Fib retracement level, at $0.0000082. The downward movement amounted to 76%.
From now on, the area is likely to act as support. Despite the bounce, there are no clear signs of a bullish reversal, since the token has yet to even create a higher low. The closest resistance area is found at $0.0000155.
Highlights
- SHIB reached an all-time high price on May 10.
- There is support and resistance at $0.0000082 and $0.0000155, respectively.
AKITA
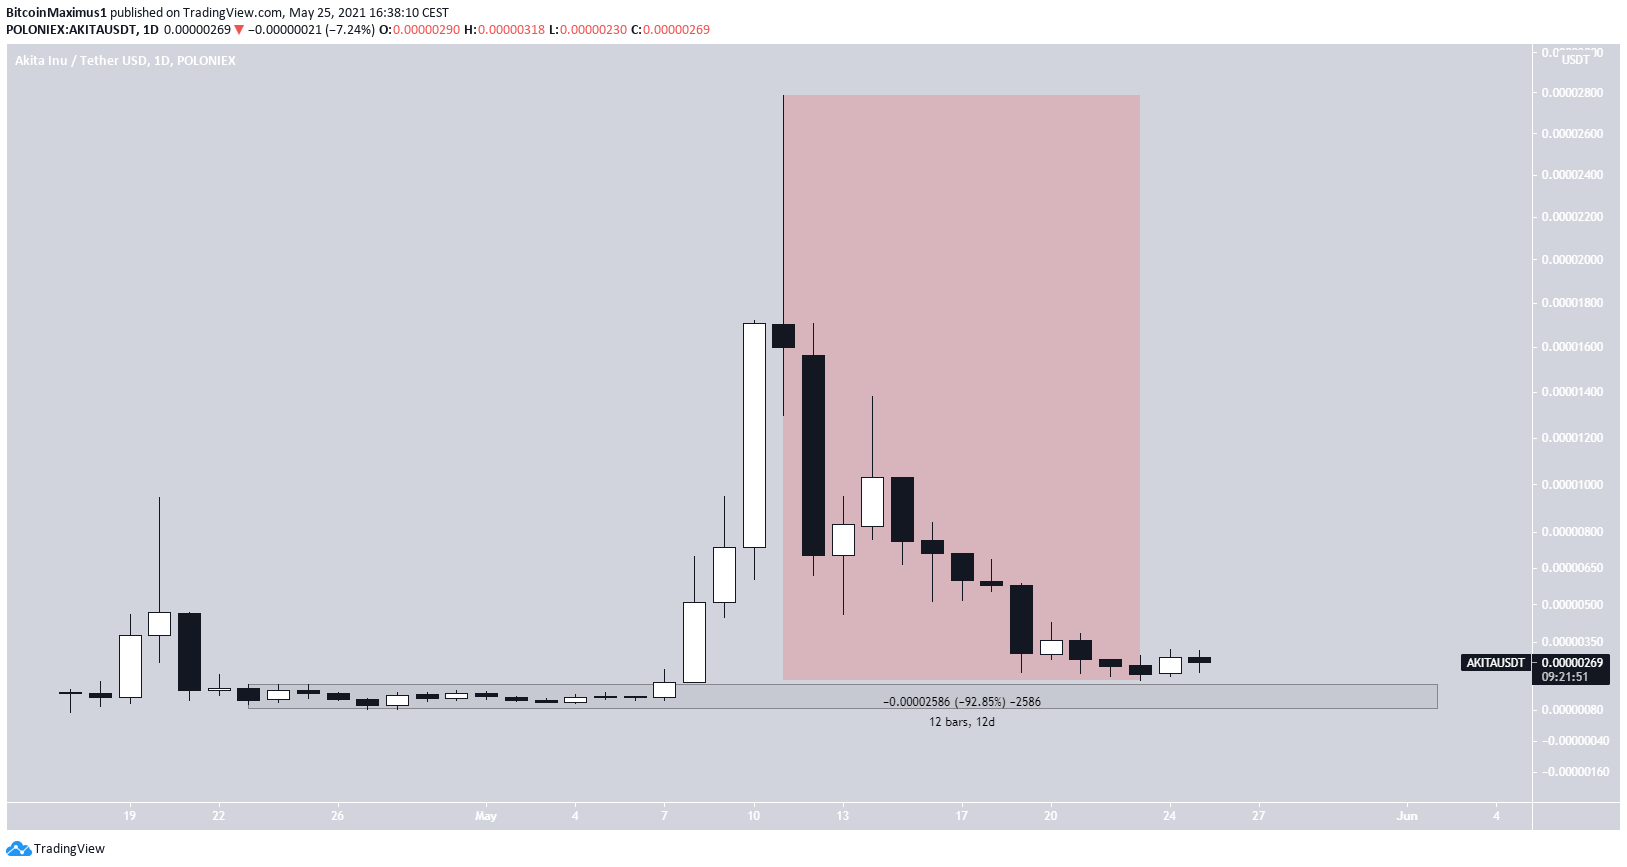
AKITA has been moving downwards since May 11, when it reached an all-time high price of $0.00002875. The move culminated with a low of $0.00000199, reached on May 12. This amounted to a decrease of 92.85%, falling below all relevant Fib retracement levels.
It is very close to the 0.00000130 support level, which acted as the all-time low throughout April. A decrease below it would take the token to bearish price discovery.
Therefore, unlike DOGE, neither SHIB nor AKITA are showing any bullish reversal signs.
Highlights
- AKITA reached an all-time high on May 11.
- It has decreased by nearly 93%.
For BeInCrypto’s latest bitcoin (BTC) analysis, click here.
Disclaimer
All the information contained on our website is published in good faith and for general information purposes only. Any action the reader takes upon the information found on our website is strictly at their own risk.
- 11
- 2019
- Action
- All
- analysis
- April
- AREA
- barcelona
- bearish
- breakout
- BTC
- Bullish
- cryptocurrencies
- cryptocurrency
- data
- Development
- discovery
- Economic
- Economics
- financial
- Focus
- General
- good
- graduate
- here
- High
- HTTPS
- information
- IT
- Level
- Line
- Making
- Markets
- move
- price
- Reader
- Risk
- School
- Signs
- So
- support
- support level
- Supports
- Technical
- token
- trader
- Trading
- Website