TL;DR Breakdown
- Dogecoin price analysis is slightly bearish on the 24-hour chart
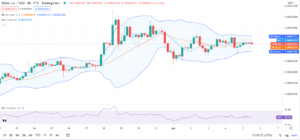
- DOGE/USD has been trading with an intraday range of $0.2777 – 0.2972
- The MACD histogram indicates short red bars
Dogecoin price analysis is slightly bearish on the 24-hour session after the meme-themed token underwent a 2.2 percent retracement overnight. The bulls attempted to overturn a descending channel during the final hours of yesterday’s session before finding rejection at the $0.31 mark.
Therefore, the coin opened the daily chart at an intraday high of $0.2900 but got pulled back into the $0.2777 zone a few minutes later. The market could go any side from here, but DOGE/USD technical indicators suggest that traders should expect losses in the next 24 hours.
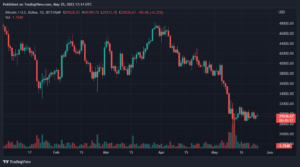
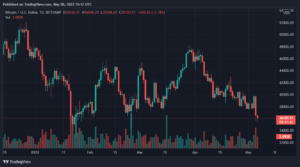
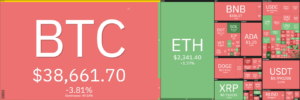
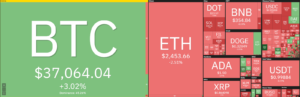
The cryptocurrency market is trading with mixed signals as we close the weekend. Bitcoin (BTC is down by 0.78 percent, Ethereum (ETH) lost 0.77 percent while Luna and Solana gained 18 and 8 percent respectively.
Dogecoin price analysis in the last 24 hours: DOGE/USD struggles to beat $0.31
According to this Dogecoin price analysis, DOGE/USD has been trading with an intraday range of $0.2777 – 0.2972. The narrow range suggests volatility is mildly distributed across the 24-hour chart. On the other hand, Dogecoin’s total trading olume saw a 34.5 percent plummet since yesterday to a sum of $1.508 billion.
Meanwhile, Dogecoin’s market capitalization is 2.10 percent down in the last 24 hours to a total of $37.2 billion. Coin Market Cap ranks the meme coin at number #7.
DOGE/USD 4-hour chart: Will DOGE rally?
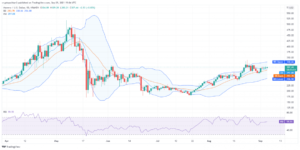
On this 4-hour Dogecoin price analysis chart, the DOGE/USD pair has risen to the $0.2840 mark, and the bulls are strongly advocating for a push beyond resistance at $0.2900.

The MACD histogram on our daily Dogecoin price analysis indicates short red bars that suggest the short-term momentum could be on the side of the bears. Green bars were only seen on the chart a few hours ago when the price was trading at $0.2900. Here the bulls were attempting to neutralize selling pressure and retest the daily high. Meanwhile, the bullish strength was unable to counter the attack, and the price reverted to a bearish trend.
Relative Strength Index (RSI) is leaning against 50 and seems to be sinking further into the oversold region. This shows the bears are in control and have a high probability of setting lower highs in the next 24 hours.
Dogecoin Price Analysis: Conclusion
Dogecoin price analysis is trading within a bearish trend line which could continue into the next 24 hours. Sellers are high between $0.2899 – $0.2999. More buyers need to enter the market in order to sustain a solid ascending channel. As you wait for a change in price action across the DOGE/USD chart, read some of our articles on NFTs and Decentralization.
Disclaimer. The information provided is not trading advice. Cryptopolitan.com holds no liability for any investments made based on the information provided on this page. We strongly recommend independent research and/or consultation with a qualified professional before making any investment decisions.Source: https://api.follow.it/track-rss-story-click/v3/tHfgumto13BMvqxOCjtCDPnNuMIJyU22
- 77
- Action
- advice
- advocating
- analysis
- articles
- bars
- bearish
- Bears
- Billion
- BTC
- Bullish
- Bulls
- capitalization
- change
- Coin
- Coin Market Cap
- continue
- cryptocurrency
- cryptocurrency market
- data
- Dogecoin
- ETH
- Green
- here
- High
- HTTPS
- index
- information
- investment
- Investments
- liability
- Line
- Making
- mark
- Market
- Market Cap
- Market Capitalization
- meme
- mixed
- Momentum
- order
- Other
- pressure
- price
- Price Analysis
- rally
- range
- research
- Sellers
- setting
- Short
- Technical
- token
- Traders
- Trading
- Volatility
- wait
- weekend
- within