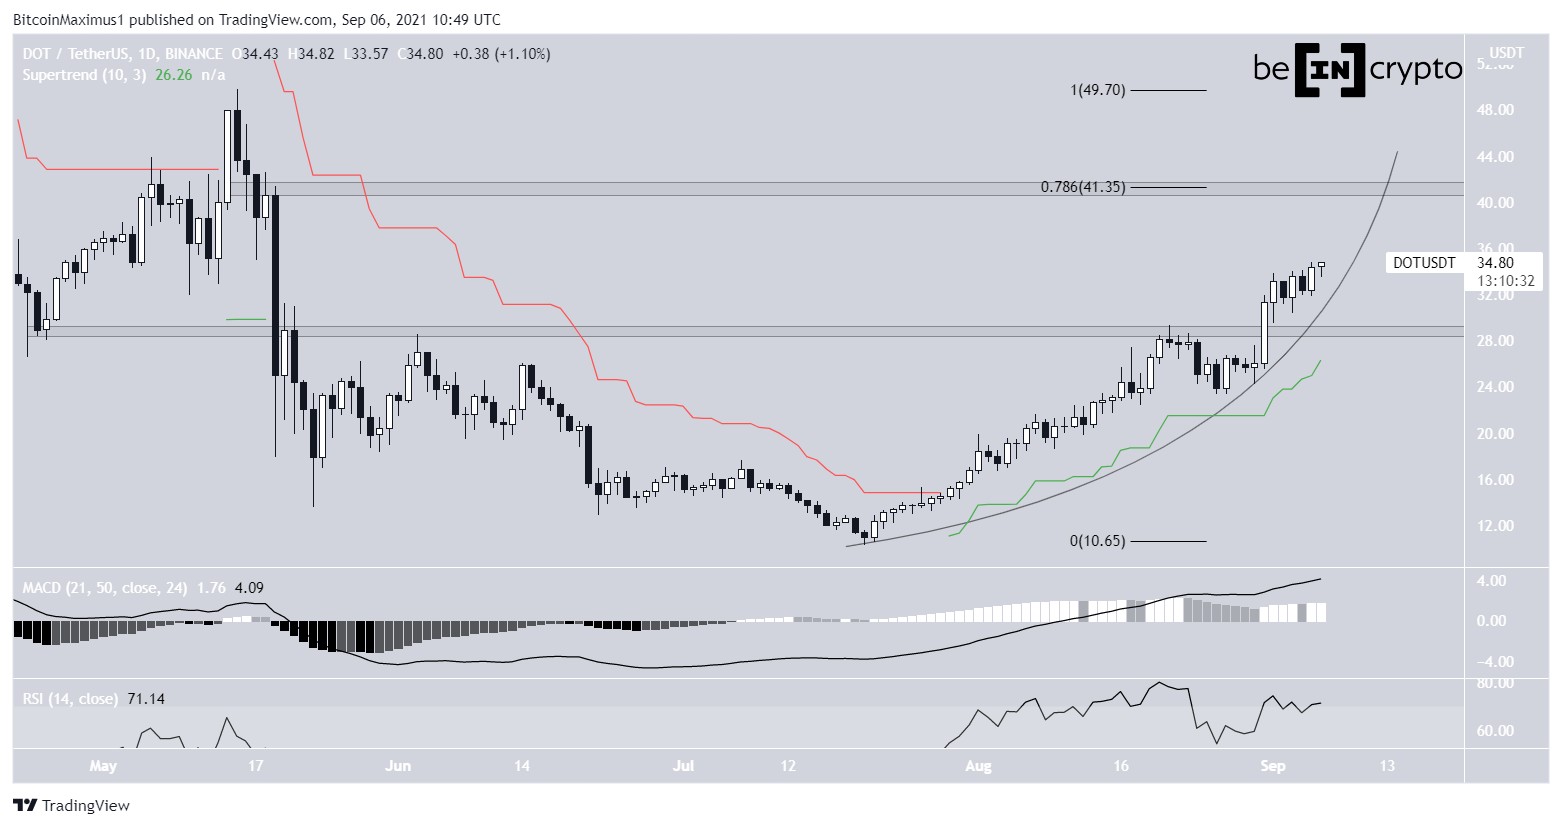
Polkadot (DOT) is moving towards the $41.35 resistance area while following a parabolic ascending support line.
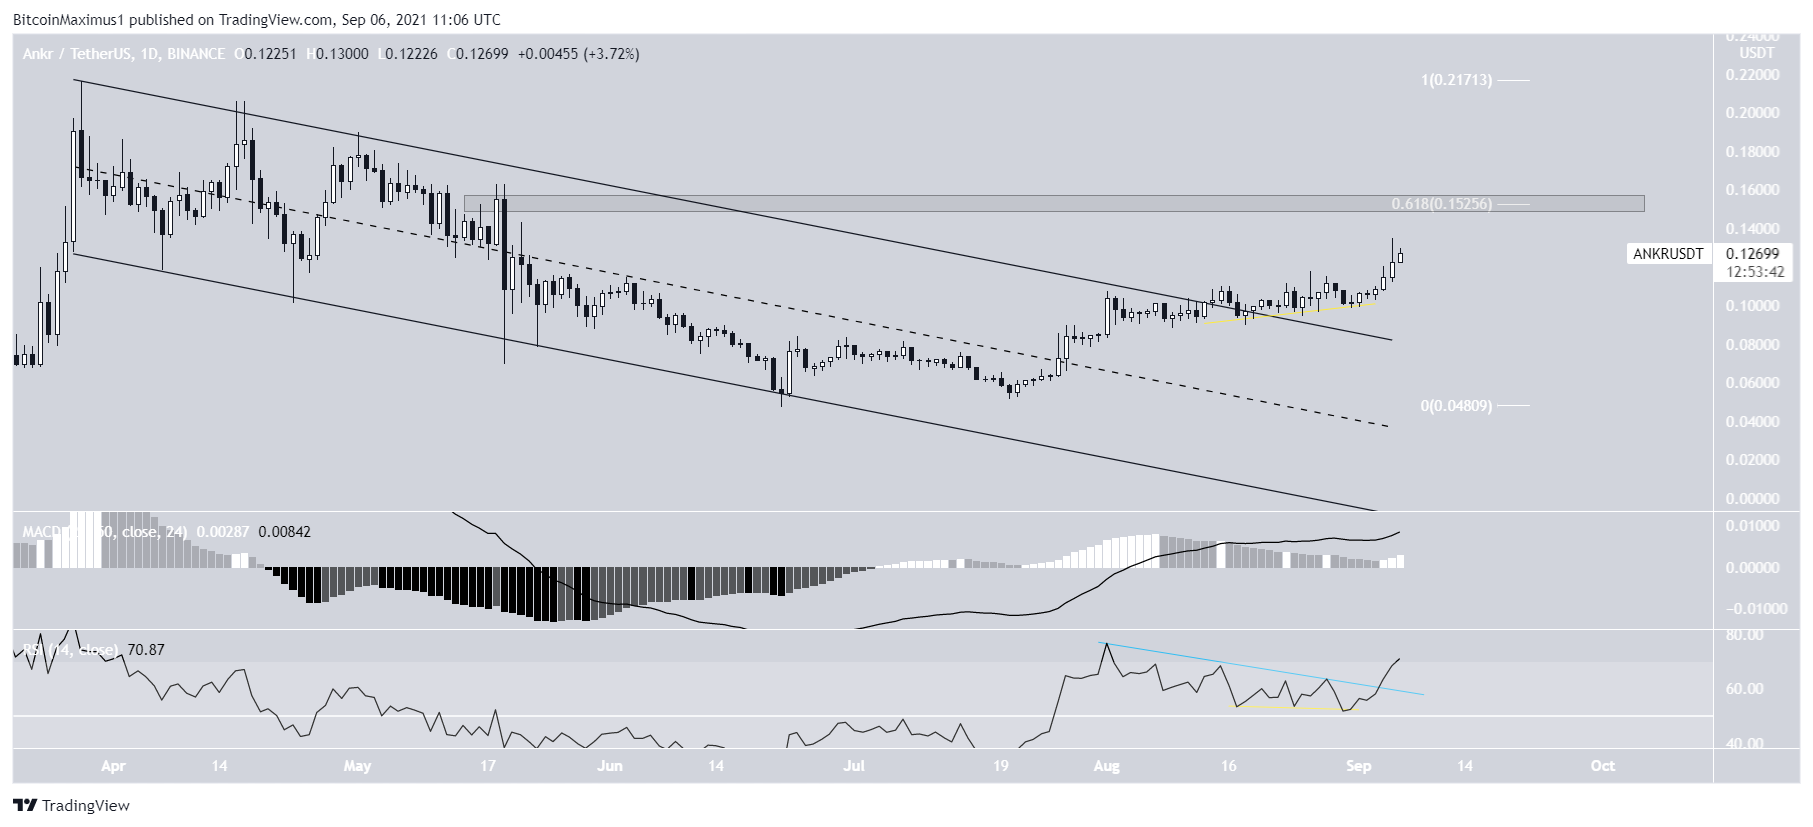
Ankr (ANKR) has broken out from a long-term descending parallel channel.
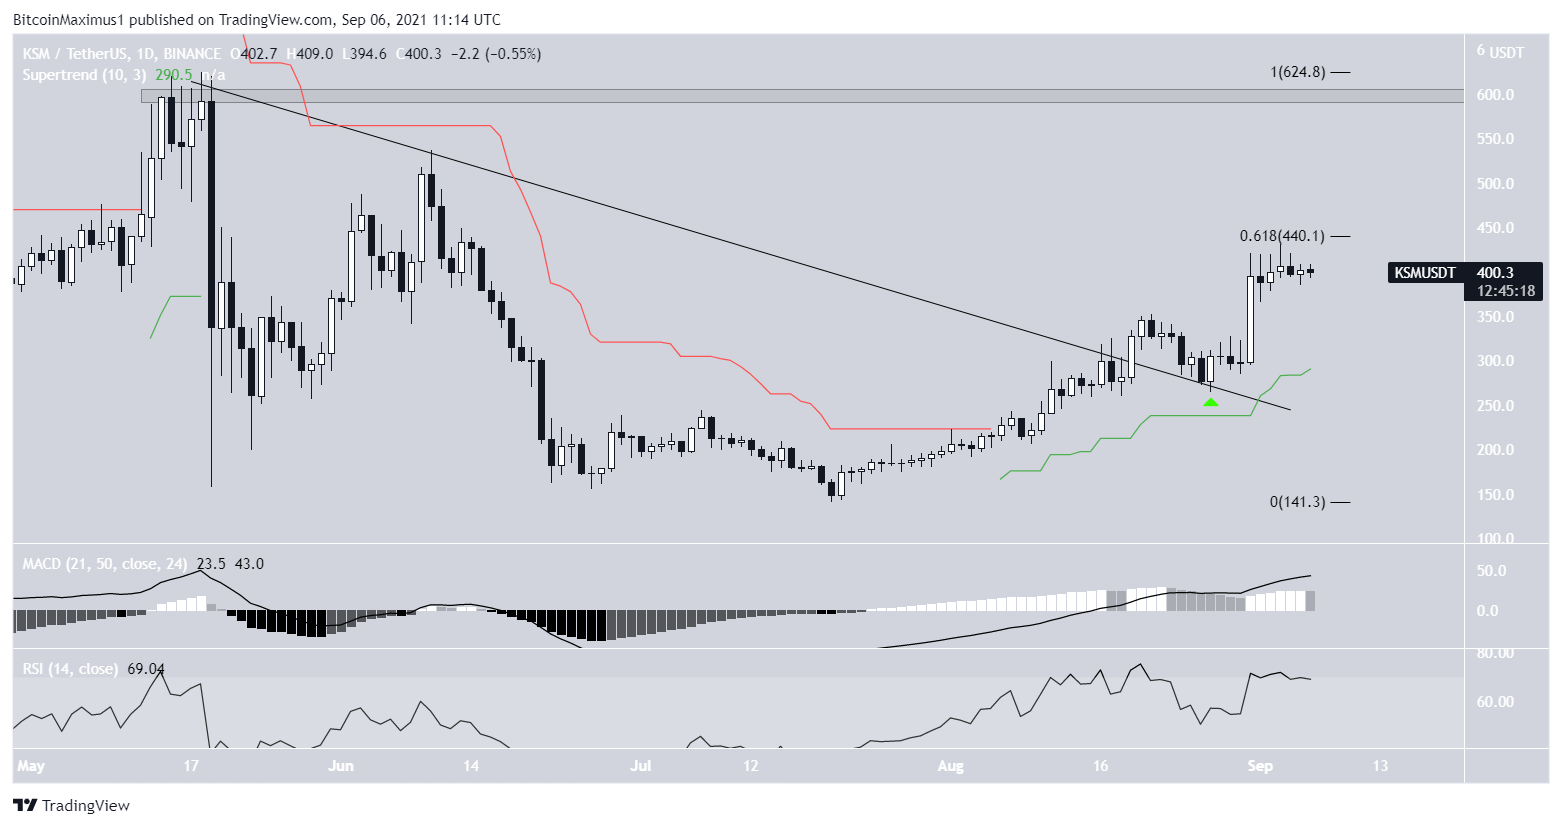
Kusama (KSM) has broken out from a descending resistance line.
DOT
DOT has been increasing alongside a parabolic ascending support line since July 20. On Aug. 21, it was rejected by the $29 resistance area and fell.
However, it resumed its upward movement on Aug. 30, bouncing at the supertrend support line and a potential parabolic ascending support line.
While the line has only been touched twice, the rate of increase since the bounce adds to its validity. Furthermore, both the MACD and RSI are increasing, even if the latter is overbought.
The closest resistance area is at $41.35. This is both a horizontal resistance area and the 0.786 Fib retracement resistance level.
A movement above this line would take DOT to a new all-time high.

Highlights
- DOT is following a parabolic ascending support line.
- There is support and resistance at $29 and $41.35.
ANKR
ANKR has been following a descending resistance line since March 28, when the token reached an all-time high price of $0.216. After decreasing for a long period of time, ANKR managed to break out on Aug. 14.
The upward movement continued after the RSI generated considerable hidden bullish divergence (yellow). Afterwards, the ensuing upward movement also broke out the descending resistance line in the RSI (blue).
The next closest resistance area is at $0.153. This is both a horizontal resistance area and the 0.618 Fib retracement resistance level (white).

Highlights
- ANKR has broken out from a descending parallel channel.
- There is resistance at $0.153.
KSM
KSM had been following a descending resistance line since May 18, when it was trading at its all-time high price of $625.
It broke out on Aug. 19 and returned to validate the line as resistance on Aug. 27 (green icon). It has been moving upwards since.
Currently, it is attempting to move above the 0.618 Fib retracement resistance level at $440. Doing so would likely take it towards the all-time high resistance area of $600. However, unlike DOT, the rally is not yet parabolic.
Technical indicators in the daily time-frame support the continuation of the upward movement. The RSI and MACD are both increasing and the supertrend is bullish.
Highlights
- KSM has broken out from a descending resistance line.
- There is resistance at $440.
For BeInCrypto’s latest Bitcoin (BTC) analysis, click here.
Disclaimer
All the information contained on our website is published in good faith and for general information purposes only. Any action the reader takes upon the information found on our website is strictly at their own risk.
Source: https://beincrypto.com/dot-nearly-goes-parabolic-ankr-ksm-could-soon-follow/