Polkadot’s DOT is moving higher from the $5.0 support against the US Dollar. The price could rally if it clears the $5.30 and $5.40 resistance levels.
- DOT is slowly moving higher above the $5.15 resistance zone against the US Dollar.
- The price is trading above the $5.20 zone and the 100 simple moving average (4 hours).
- There is a key bullish trend line forming with support near $5.10 on the 4-hour chart of the DOT/USD pair (data source from Kraken).
- The pair could gain bullish momentum if there is a close above the $5.30 resistance.
Polkadot’s DOT Price Aims Higher
After a sharp decline, DOT price found support near the $5.0 zone. A low is formed near $4.98 and the price is now attempting a fresh increase, similar to Bitcoin and Ethereum.
There was a break above the $5.15 and $5.20 resistance levels. There is also a key bullish trend line forming with support near $5.10 on the 4-hours chart of the DOT/USD pair. The pair is now trading above the $5.20 zone and the 100 simple moving average (4 hours).
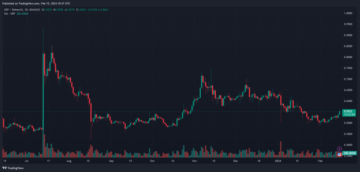
Immediate resistance is near the $5.30 level. It is near the 50% Fib retracement level of the downward move from the $5.62 swing high to the $4.98 low.
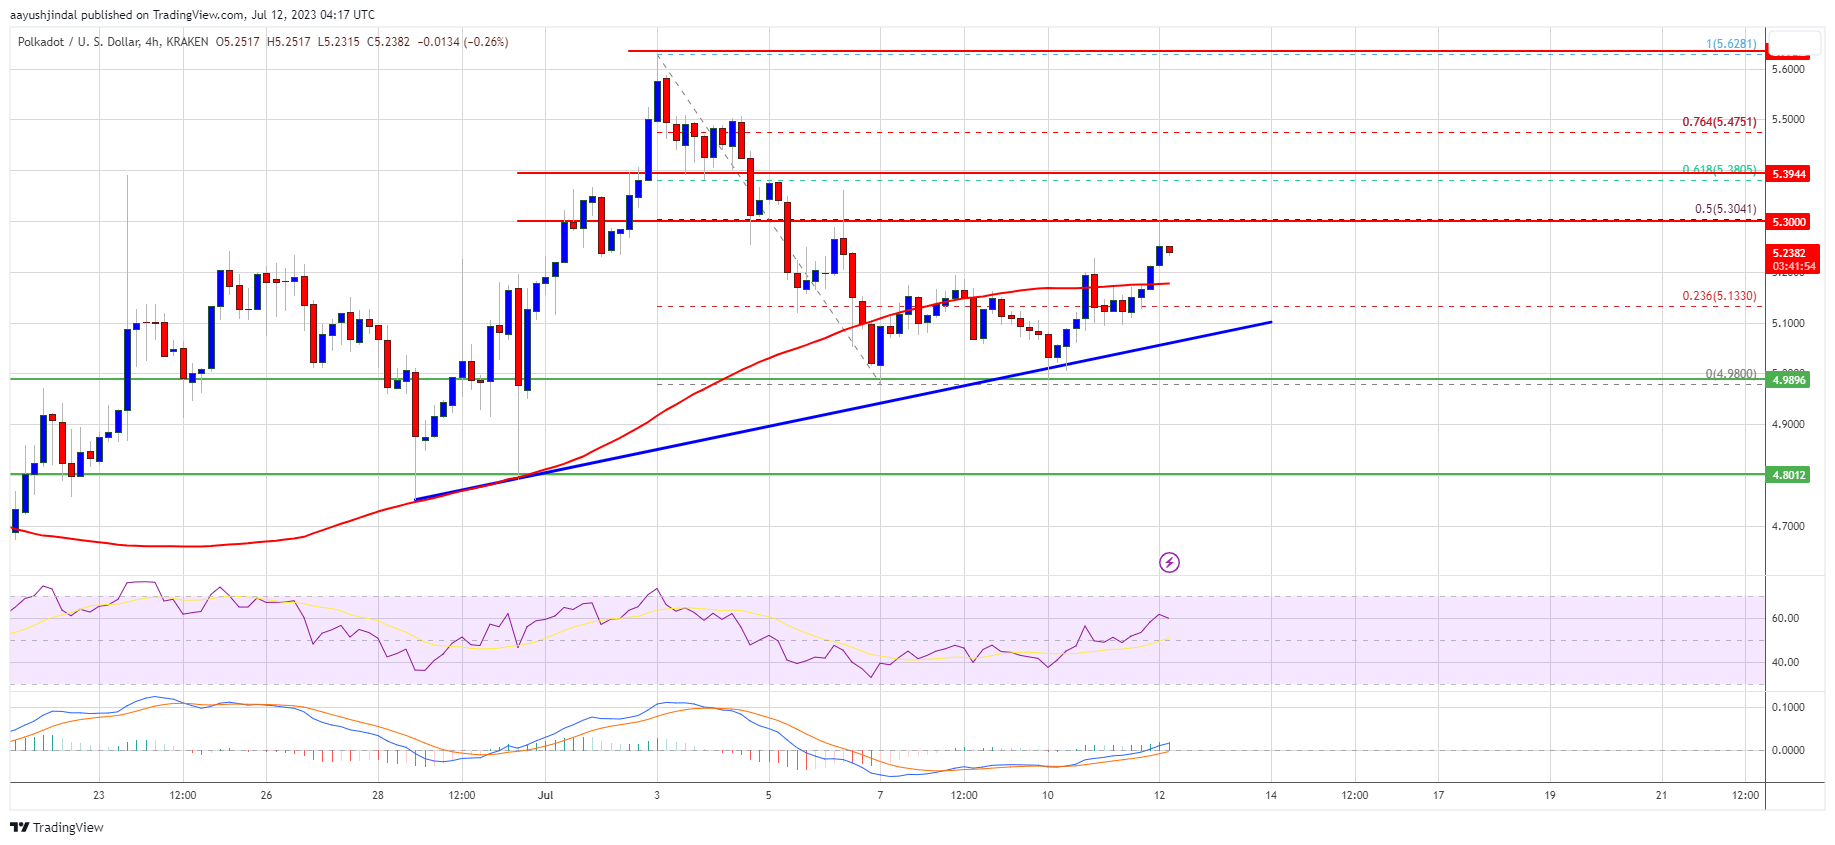
Source: DOTUSD on TradingView.com
The next major resistance is near $5.40 or the 61.8% Fib retracement level of the downward move from the $5.62 swing high to the $4.98 low. A successful break above $5.40 could start a strong rally. In the stated case, the price could easily rally toward $5.60 in the coming sessions. The next major resistance is seen near the $6.0 zone.
Dips Limited?
If DOT price fails to continue higher above $5.30 or $5.40, it could start a downside correction. The first key support is near the $5.15 level and the 100 simple moving average (4 hours).
The next major support is near the $5.10 level and the trend line, below which the price might decline to $5.00. Any more losses may perhaps open the doors for a move toward the $4.80 support zone in the coming sessions.
Technical Indicators
4-Hours MACD – The MACD for DOT/USD is now gaining momentum in the bullish zone.
4-Hours RSI (Relative Strength Index) – The RSI for DOT/USD is now above the 50 level.
Major Support Levels – $5.15, $5.10 and $5.00.
Major Resistance Levels – $5.30, $5.40, and $5.60.
- SEO Powered Content & PR Distribution. Get Amplified Today.
- PlatoData.Network Vertical Generative Ai. Empower Yourself. Access Here.
- PlatoAiStream. Web3 Intelligence. Knowledge Amplified. Access Here.
- PlatoESG. Automotive / EVs, Carbon, CleanTech, Energy, Environment, Solar, Waste Management. Access Here.
- BlockOffsets. Modernizing Environmental Offset Ownership. Access Here.
- Source: https://www.newsbtc.com/analysis/dot/dot-price-polkadot-rally-to-6/
- :is
- 10
- 100
- 15%
- 20
- 30
- 40
- 50
- 60
- 80
- 98
- a
- above
- against
- aims
- also
- and
- any
- attempting
- average
- below
- Break
- Bullish
- case
- Chart
- Close
- coming
- continue
- could
- data
- Decline
- Dollar
- doors
- DOT
- dot price
- DOT/USD
- downside
- downward
- easily
- fails
- First
- For
- formed
- found
- fresh
- fresh increase
- from
- Gain
- gaining
- High
- higher
- HOURS
- HTTPS
- if
- in
- Increase
- index
- Indicators
- IT
- Key
- Kraken
- Level
- levels
- Limited
- Line
- losses
- Low
- MACD
- major
- max-width
- May..
- might
- Momentum
- more
- move
- moving
- moving average
- Near
- NewsBTC
- next
- now
- of
- on
- open
- or
- pair
- perhaps
- plato
- Plato Data Intelligence
- PlatoData
- Polkadot
- price
- rally
- relative
- relative strength index
- Resistance
- retracement
- rsi
- seen
- sessions
- sharp
- similar
- Simple
- Slowly
- Source
- start
- stated
- strength
- strong
- successful
- suggest
- support
- support levels
- Swing
- The
- There.
- to
- toward
- Trading
- TradingView
- Trend
- us
- US Dollar
- was
- which
- with
- zephyrnet