Published 41 mins ago
Dow theory suggests that market trends have three phases – accumulation, public participation, and distribution. After the Ethereum price peaked at the $4,891 All-Time High in November 2021, the distribution phase triggered the investors to begin to sell their positions, leading to a decline in price. Thus, this altcoin tumbled 82% from the ATH to reach a low of $896.1. However, in the weekly chart, the ETH price showed a sideways/accumulation phase for the last ten months indicating the investors are now accumulating at a discounted price. The recent growth in the coin price represents that the buyers are now ready to switch to the public participation phase and lead a massive bull run.
advertisement
Key Points:
- Dow theory reflects an early sign of trend change
- A bullish breakout from the symmetrical triangle pattern offers a buying opportunity to interested traders.
- The intraday trading volume in Ether is $14.4 billion, indicating a 4% gain.
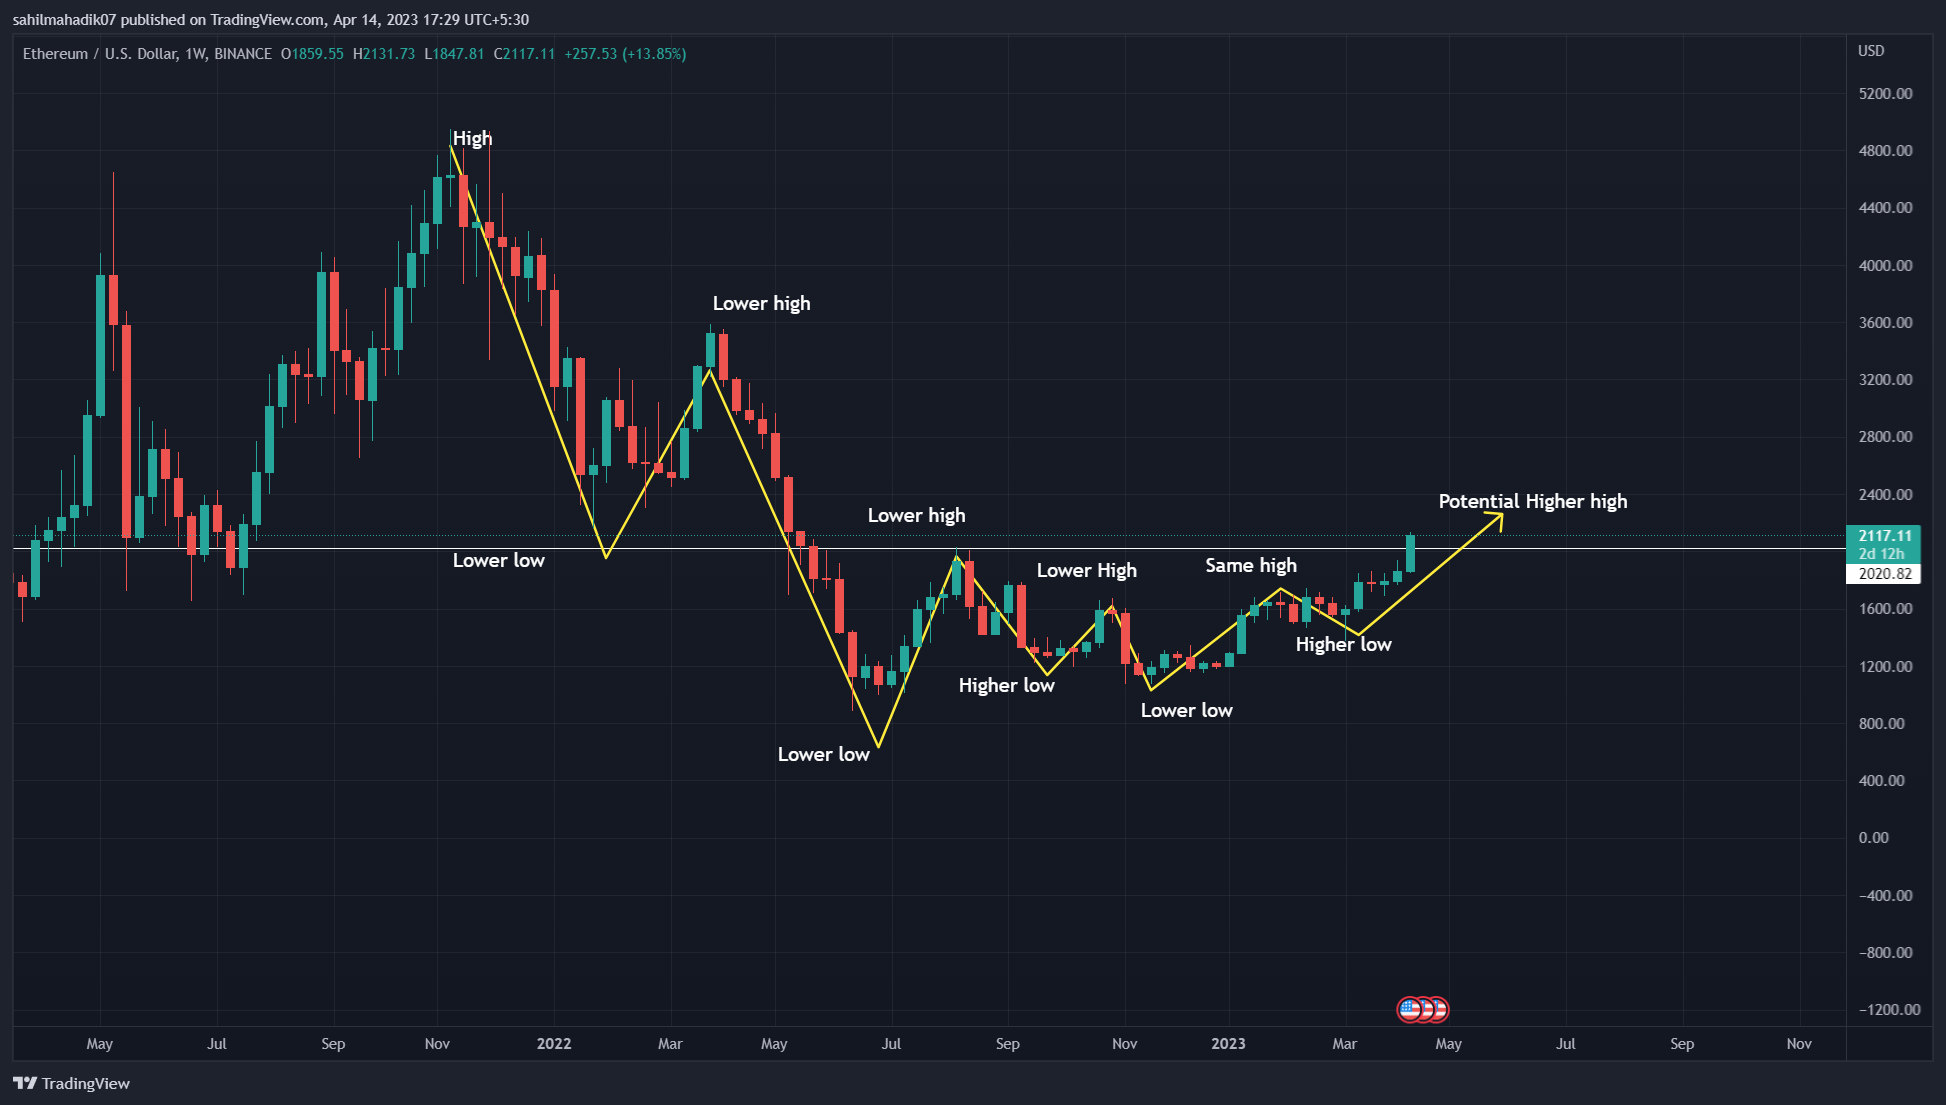
Source- Tradingview
In the above chart, the Ethereum price trend clearly represents a downtrend( lower high and lower low formation) shifting into a sideways trend(accumulation phase). Furthermore, the consolidation phase has lasted for the past ten months and shows early signs of trend reversal with higher low formation.
Moreover, with the ongoing recovery in the crypto market, the Ethereum price has recently breached the August 2022 peak of $2000, suggesting a potential formation of higher highs in price action.
Trending Stories
This higher low and higher high trend is a key trait of an established uptrend indicates the Ethereum price will soon ride a significant price rally.
Also Read: Ethereum Institutional Demand Rises, Will ETH Put BTC Out of Crypto Spotlight?
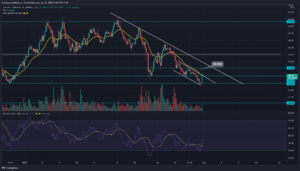
Bullish Breakout From Chart Pattern

Source- Tradingview
During the long consolidation mentioned above, the Ethereum price trend shows the formation of a symmetrical triangle pattern. Under the influence of this pattern, the price resonates between two converging trendlines whose breakout determines the further trend for the coin.
On March 17th, the prices gave a massive breakout from the pattern’s resistance trendline, offering buyers significant footing to rise higher. In ideal bullish conditions, the triangle breakout target is the same distance between the first price swing within the pattern shot from breakout points.
Thus, with sustained buying, the Ethereum price rally could surpass the $2800 mark.
Technical Indicator
RSI: An evident growth in the weekly RSI slope reflects a sustained growth in the Ethereum price.
EMAs: the reclaimed weekly EMAs(20, 50, 100, and 200) could offer significant support during the occasional pullbacks in the Ethereum rally.
Ethereum Coin Price Intraday Levels-
- Spot rate: $2115
- Trend: Bullish
- Volatility: High
- Resistance level- $2400 and $2700
- Support level- $2000 and $1800
Share this article on:
advertisement
The presented content may include the personal opinion of the author and is subject to market condition. Do your market research before investing in cryptocurrencies. The author or the publication does not hold any responsibility for your personal financial loss.
<!– Close Story–>
- SEO Powered Content & PR Distribution. Get Amplified Today.
- Platoblockchain. Web3 Metaverse Intelligence. Knowledge Amplified. Access Here.
- Source: https://coingape.com/markets/dow-theory-reflects-critical-reversal-in-ethereum-price-trend-best-to-buy/
- :is
- 1
- 10
- 100
- 2021
- 2022
- 7
- 8
- 9
- a
- above
- accumulation
- Action
- Ad
- After
- Altcoin
- and
- ARE
- article
- At
- ATH
- AUGUST
- author
- avatar
- banner
- Beauty
- before
- begin
- BEST
- between
- Billion
- blockchain
- breakout
- Brian
- BTC
- bull
- Bull Run
- Bullish
- buy
- buyers
- Buying
- Chart
- clearly
- Coin
- Coingape
- COM
- condition
- conditions
- consolidation
- content
- converging
- could
- critical
- crypto
- Crypto Market
- cryptocurrencies
- cryptocurrency
- Decline
- Demand
- details
- determines
- different
- distance
- distribution
- dow
- during
- Early
- Entertainment
- established
- ETH
- eth price
- Ether
- Ether (ETH)
- ethereum
- ethereum (ETH)
- Ethereum Price
- ethereum rally
- Fashion
- finance
- financial
- First
- follow
- For
- formation
- from
- further
- Furthermore
- Gain
- Growth
- Have
- High
- higher
- Highs
- hold
- However
- HTTPS
- i
- ideal
- in
- include
- Including
- indicates
- influence
- Institutional
- interested
- investing
- Investors
- journalism
- jpg
- Key
- Last
- lead
- leading
- Long
- loss
- Low
- March
- mark
- Market
- market research
- Market Trends
- massive
- May..
- mentioned
- months
- November
- November 2021
- occasional
- of
- offer
- offering
- Offers
- on
- ongoing
- Opinion
- Opportunity
- participation
- past
- Pattern
- Peak
- peaked
- personal
- phase
- plato
- Plato Data Intelligence
- PlatoData
- plugin
- points
- positions
- potential
- presented
- price
- PRICE ACTION
- price rally
- Prices
- public
- Publication
- put
- rally
- Rate
- reach
- Read
- ready
- recent
- recently
- recovery
- reflects
- represents
- research
- Resistance
- resonates
- responsibility
- Reversal
- Ride
- Rise
- Rises
- Run
- same
- sell
- shanghai
- Share
- SHIFTING
- Shows
- sideways
- sign
- significant
- Signs
- Soon
- Spotlight
- subject
- Suggests
- support
- surpass
- sustained
- Swing
- Switch
- Symmetrical Triangle
- Target
- ten
- that
- The
- The Weekly
- their
- three
- to
- Topics
- Traders
- Trading
- trading volume
- TradingView
- Trend
- trending
- Trends
- triggered
- under
- upgrade
- uptrend
- variety
- volume
- weekly
- will
- with
- withdrawn
- within
- working
- written
- years
- Your
- zephyrnet