Price extremes such as Oversold and Overbought Price Levels often lead to a Mean Reversal. This is a scenario in which the price would quickly swing in the opposite direction price becomes too high or too low. These market conditions may sometimes lead to a Trend Reversal, which often presents good trading opportunities.
In this strategy, we will discuss how we can use the Dynamic Trend Indicator and the RSI to find such trend reversal trading opportunities coming from an oversold or overbought market.
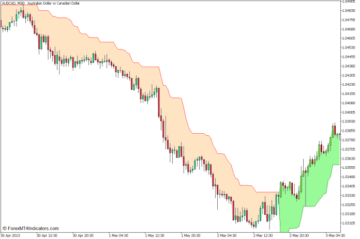
Dynamic Trend Indicator
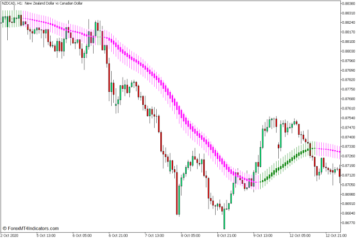
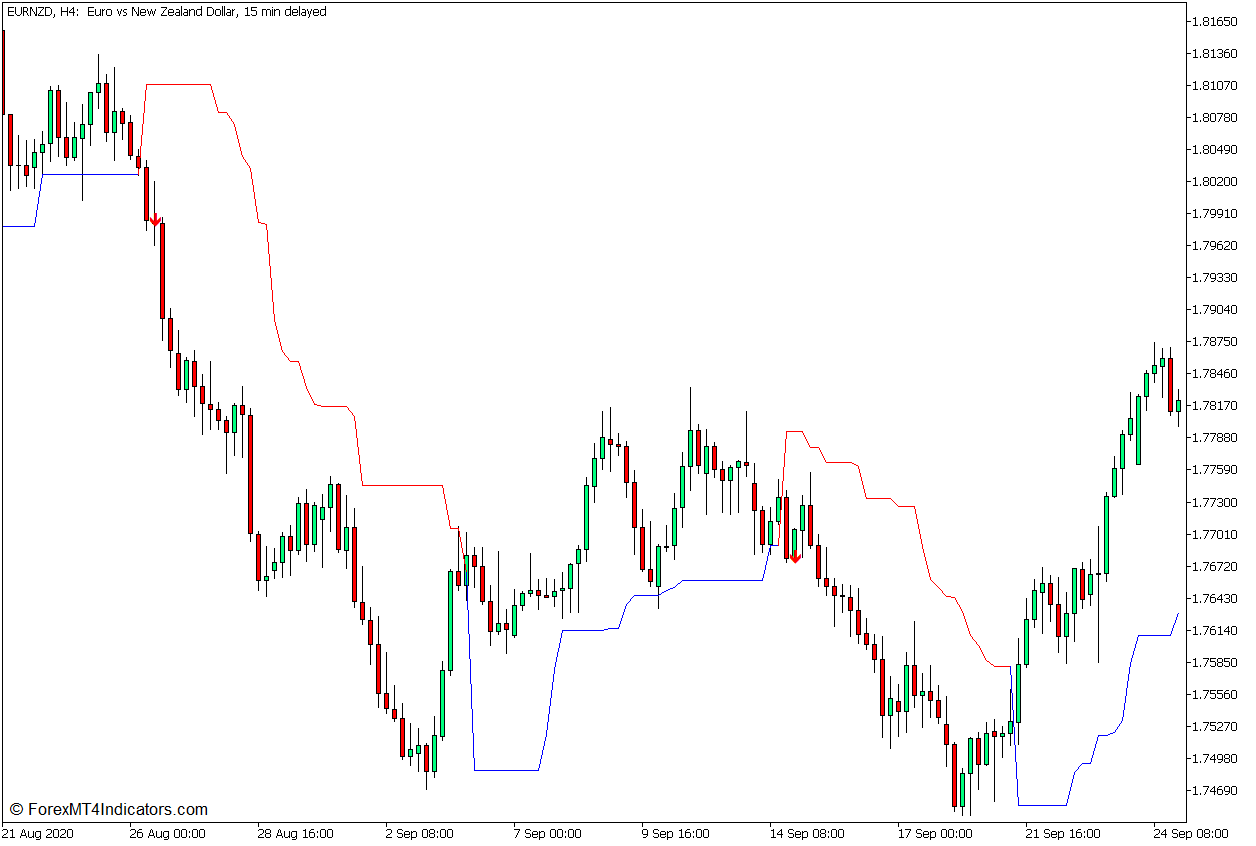
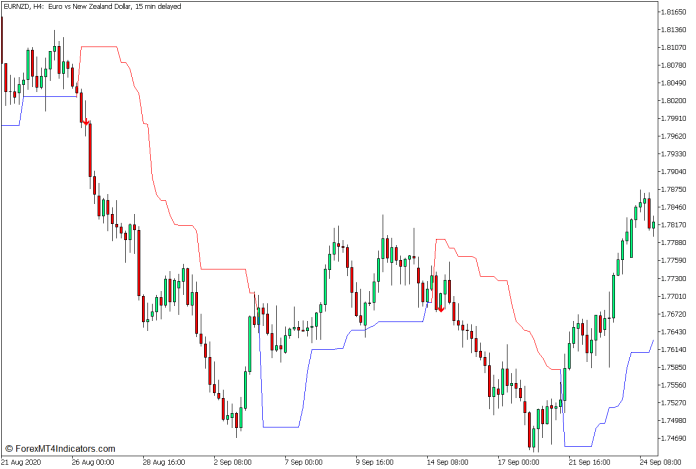
A dynamic Trend Indicator is a trend-following technical indicator that was developed to help traders objectively identify trend direction and trend reversals. It presents trend direction using a line that follows price action, shifting above or below it based on the direction of the trend, and changing color as it detects trend reversals.
This indicator shares many similarities with the Supertrend Indicator, which also plots a line that follows price action and shifts above or below price to indicate trend direction. It also plots its line based on the highest high or lowest low of price within a given period, which is also similar to the Supertrend Indicator.
However, the Dynamic Trend Indicator does have a different algorithm for it to detect trend reversals. Unlike the Supertrend Indicator which uses the Average True Range (ATR) as a basis for measuring the distance between the highest high or lowest low from its threshold line, the Dynamic Trend Indicator uses a percentage of the movement of price as a basis for measuring the distance between the high or low of price from its threshold line.
The Dynamic Trend Indicator calculates the movement of the price which equates to its percentage threshold, in which case is preset to 10%. However, this input variable can be modified within the indicator settings. In an uptrend, the indicator measures the equivalent distance in pips by subtracting the percentage distance from the highest close of price within the given period. The resulting value becomes the level where the indicator would draw its threshold line. Inversely, in a downtrend, the indicator adds the percentage distance to the lowest close of the price to draw its threshold line.
- Uptrend Line = Highest Close within n Periods – Percentage
- Downtrend Line = Lowest Close within n Periods + Percentage
The Dynamic Trend Indicator detects trend reversals whenever price crosses over its line and closes on the opposite side of the line. The threshold line then shifts and changes color indicating a trend reversal.
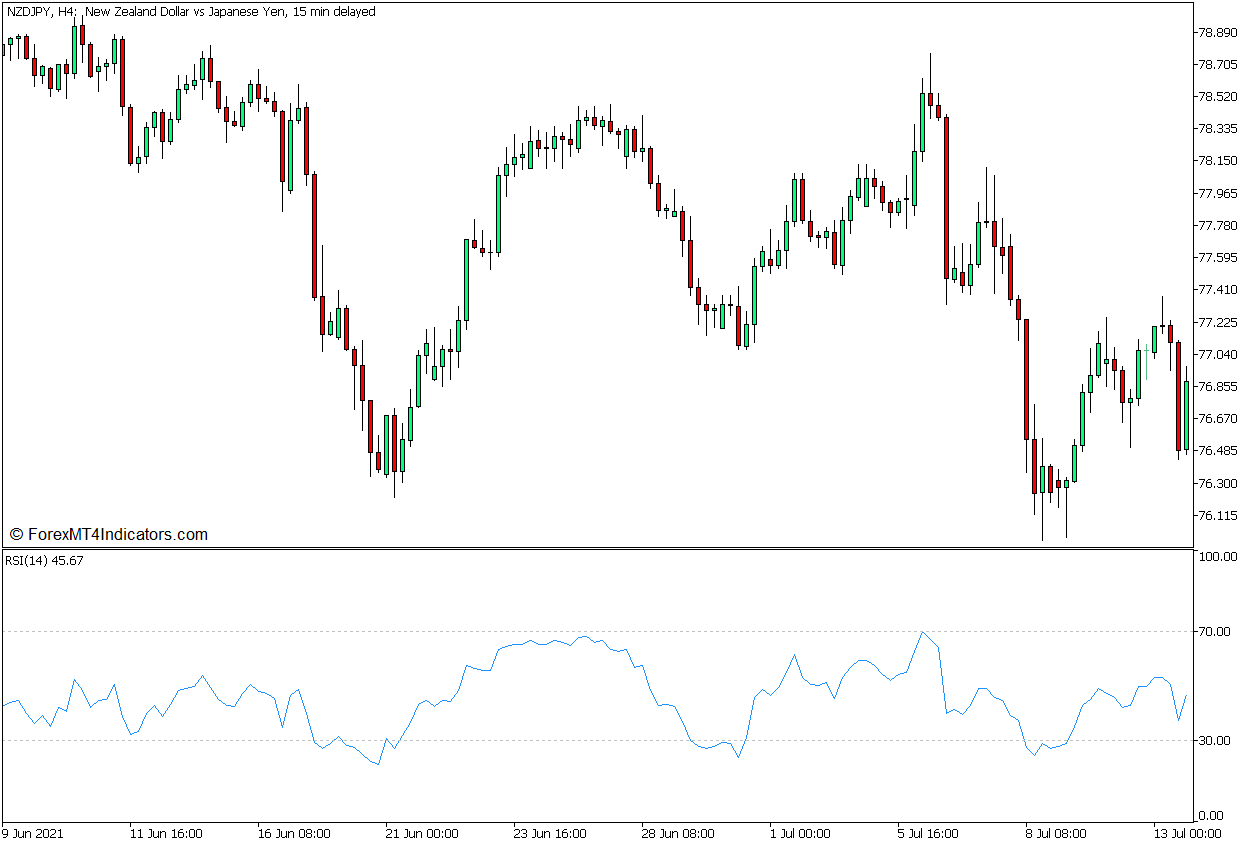
Relative Strength Index
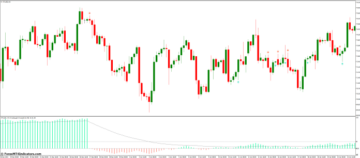
The Relative Strength Index (RSI) is a technical indicator developed by J. Welles Wilder in 1978 and published in his book, New Concepts in Technical Trading Systems. This indicator is widely used by traders to objectively identify the direction of the market’s momentum, as well as oversold and overbought market conditions, which may lead to potential mean reversals.
The RSI has a complex formula and algorithm that compares the upward and downward movements of prices. It then inputs these values to its formula, which normalizes the ratio between the upward and downward movement of price within a range of 0 to 100.
The RSI draws an oscillator line which oscillates within the range of 0 to 100. The said range also has markers at levels 30 to 70, which we could consider as the normal range of price. In an uptrend or bullish momentum market, the RSI line would gravitate towards the upper end of the range. Inversely, in a downtrend or bearish momentum market, the RSI line would also gravitate towards the lower end of the same range.
The markers at levels 30 and 70 are considered thresholds for identifying oversold and overbought markets. An RSI line that drops below 30 is indicative of an oversold market. On the other hand, an RSI line that breaches above 70 is indicative of an overbought market. Both these conditions may lead to a mean reversal scenario, wherein the price would revert to the opposite end of its range.

Trading Strategy Concept
This trading strategy is a trend reversal trading strategy that trades on trend reversal signals that originate from an oversold or overbought market condition. This is done using the Dynamic Trend Indicator and the Relative Strength Index.
The RSI is used so that we can objectively identify oversold or overbought markets. This is based on the RSI line braking outside the 30 to 70 range. If the oversold or overbought condition is met, we could then start observing for potential trend reversals coming from an extreme price level.
The Dynamic Trend Indicator is then used as an objective trend reversal signal. The trend reversal signal would come in the form of a shifting of the Dynamic Trend line, the changing of its color, and the appearance of an arrow pointing in the direction of the trend reversal. Trades are considered only when there is a confluence between the shifting of the line and the appearance of a signal arrow.
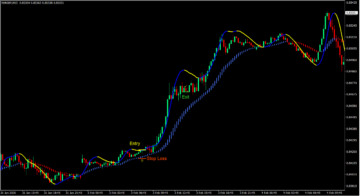
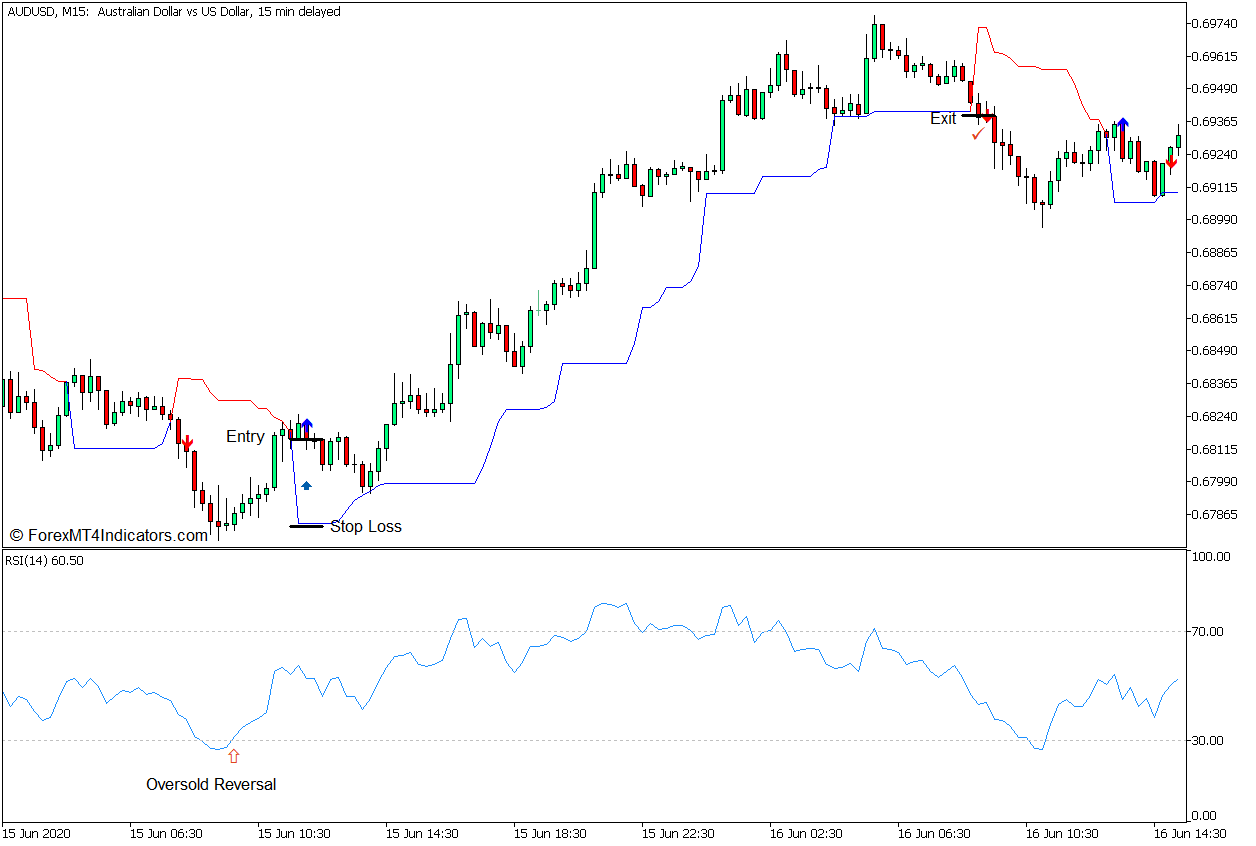
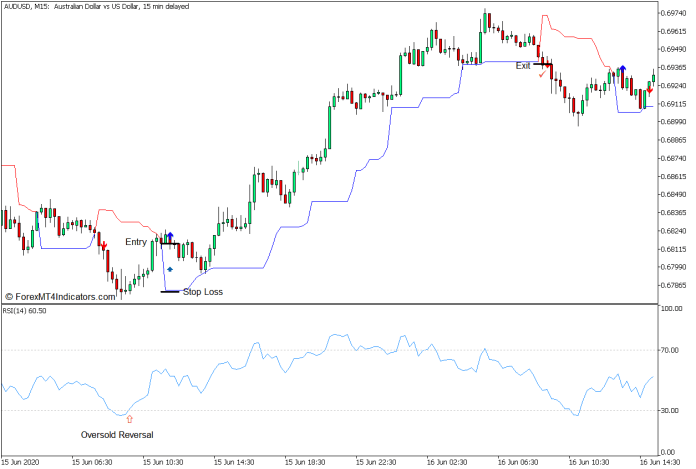
Buy Trade Setup
Entry
- The RSI line should drop below 30 indicating an oversold market.
- The Dynamic Trend line should shift below the price action and change to blue.
- The Dynamic Trend indicator should plot a blue arrow pointing up.
- Open a buy order on the confluence of these bullish reversal signals.
Stop Loss
- Set the stop loss below the Dynamic Trend line.
Exit
- Close the trade as soon as the price closes below the Dynamic Trend line.
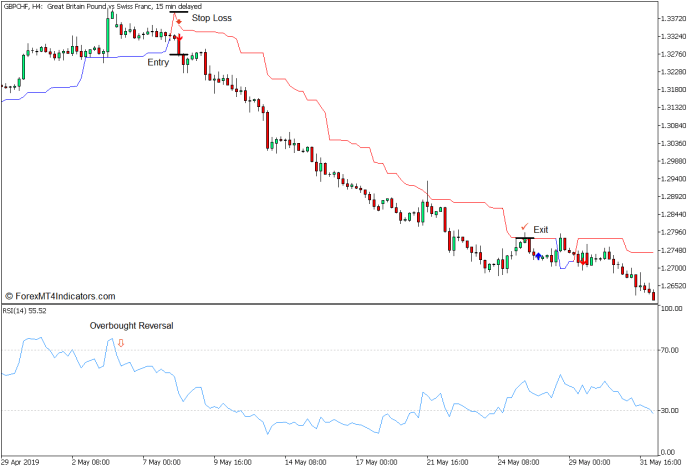
Sell Trade Setup
Entry
- The RSI line should breach above 70 indicating an overbought market.
- The Dynamic Trend line should shift above price action and change to red.
- The Dynamic Trend indicator should plot a red arrow pointing down.
- Open a sell order on the confluence of these bearish reversal signals.
Stop Loss
- Set the stop loss above the Dynamic Trend line.
Exit
- Close the trade as soon as the price closes above the Dynamic Trend line.

Conclusion
This trading strategy may not be considered as a high-probability trading strategy. This is because anticipating a trend reversal is not that easy given that in such conditions, traders are often expecting the price to continue in the direction of the trend. However, whenever the market does reverse, traders are often presented with trades that have higher yields about the risk placed on the trade. Traders should practice this strategy before implementing it as it often takes skill to isolate the correct trading opportunities and avoid trades that are more likely to fail.
Recommended MT5 Broker
- Free $50 To Start Trading Instantly! (Withdrawable Profit)
- Deposit Bonus up to $5,000
- Unlimited Loyalty Program
- Award Winning Forex Broker
- Additional Exclusive Bonuses Throughout The Year

>> Claim Your $50 Bonus Here <<
Click here below to download:
Save
Save
- SEO Powered Content & PR Distribution. Get Amplified Today.
- PlatoData.Network Vertical Generative Ai. Empower Yourself. Access Here.
- PlatoAiStream. Web3 Intelligence. Knowledge Amplified. Access Here.
- PlatoESG. Carbon, CleanTech, Energy, Environment, Solar, Waste Management. Access Here.
- PlatoHealth. Biotech and Clinical Trials Intelligence. Access Here.
- Source: https://www.forexmt4indicators.com/dynamic-trend-rsi-reversal-forex-trading-strategy-for-mt5/?utm_source=rss&utm_medium=rss&utm_campaign=dynamic-trend-rsi-reversal-forex-trading-strategy-for-mt5
- :has
- :is
- :not
- :where
- $UP
- 100
- 30
- 70
- a
- About
- above
- Action
- Adds
- algorithm
- also
- an
- and
- anticipating
- ARE
- AS
- At
- average
- avoid
- based
- basis
- BE
- bearish
- Bearish Momentum
- because
- becomes
- before
- below
- between
- Blue
- Bonus
- book
- both
- breach
- breaches
- Bullish
- buy
- by
- calculates
- CAN
- case
- change
- Changes
- changing
- claim
- Close
- Closes
- color
- come
- coming
- complex
- concepts
- condition
- conditions
- confluence
- Consider
- considered
- continue
- correct
- could
- detect
- developed
- different
- direction
- discuss
- distance
- does
- done
- down
- download
- downward
- draw
- draws
- Drop
- Drops
- dynamic
- easy
- end
- entry
- equates
- Equivalent
- Exclusive
- expecting
- extreme
- extremes
- FAIL
- Find
- follows
- For
- forex
- Forex Trading
- form
- formula
- from
- given
- good
- hand
- Have
- help
- here
- High
- higher
- highest
- his
- How
- However
- HTTPS
- identify
- identifying
- if
- implementing
- in
- index
- indicate
- indicating
- indicative
- Indicator
- input
- inputs
- IT
- ITS
- lead
- Level
- levels
- likely
- Line
- loss
- Low
- lower
- lowest
- Loyalty
- many
- Market
- market conditions
- Markets
- max-width
- May..
- mean
- measures
- measuring
- met
- modified
- Momentum
- more
- movement
- movements
- normal
- objective
- objectively
- observing
- of
- often
- on
- only
- opportunities
- opposite
- or
- order
- Other
- outside
- over
- percentage
- period
- periods
- PHP
- placed
- plato
- Plato Data Intelligence
- PlatoData
- plot
- potential
- practice
- presented
- presents
- price
- PRICE ACTION
- Prices
- Profit
- published
- quickly
- range
- ratio
- Red
- relative
- relative strength index
- Relative Strength Index (RSI)
- resulting
- Reversal
- reverse
- revert
- Risk
- rsi
- Said
- same
- scenario
- sell
- settings
- Shares
- shift
- SHIFTING
- Shifts
- should
- side
- Signal
- signals
- similar
- similarities
- skill
- So
- sometimes
- Soon
- start
- Stop
- Strategy
- strength
- subtracting
- such
- Swing
- takes
- Technical
- that
- The
- then
- There.
- These
- this
- threshold
- throughout
- to
- too
- towards
- trade
- Traders
- trades
- Trading
- trading strategy
- Trend
- true
- unlike
- uptrend
- upward
- use
- used
- uses
- using
- value
- Values
- variable
- was
- we
- WELL
- when
- whenever
- which
- widely
- will
- winning
- with
- within
- would
- yields
- Your
- zephyrnet