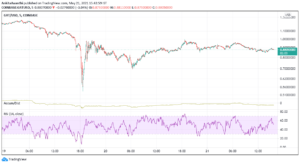
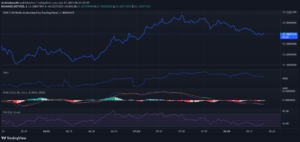
The ENJ coin price shows a bullish reversal within a long-coming falling wedge pattern as Metaverse coins gain bullish attention. Enjin Coin is a subsidiary of Enjin, which offers an interconnected ecosystem of games that are based on blockchain technology. The flagship product of Enjin is the Enjin Network, a social gaming platform where players can create clans and websites. Enjin lets game developers tokenize game items using their Ethereum blockchain. It utilizes Enjin Coin, an ERC-20 token, to secure the digital assets created by its platform. This means that products can be purchased, sold, or traded using real-world value. Let us move ahead to read about Enjin technical analysis. Past Performance of ENJ The ENJ coin price action forms a long-coming support trendline in the daily chart. Currently, the price bounces from the trendline and the $1.5 horizontal level to rise more than 10% in the past 24 hours. Therefore, a price jump to the next level at $2.15 is possible. ENJ/USD Daily Chart ENJ Technical Analysis The ENJ coin price action creates a huge falling wedge pattern in the 24-hour chart, with a price jump from the support trendline. Hence, a further bullish continuation within the pattern to the resistance trendline is possible. The crucial Exponential Moving Averages struggle to maintain a bullish alignment in the daily chart after the bearish crossover of the 50 and 100-day EMA. The price breaks below the 200-day EMA, however, the recent jump hints at a possible fallout retest. The DMI Indicator shows the ADX above 30%, reflecting a solid trend momentum in play. But the -DI remains higher than the +DI line despite a recent reversal in the lines supporting a bullish comeback. The MACD Indicator shows a parabolic reversal in the fast line as it approaches to cut higher above the signal line. Therefore, a bullish crossover indicating a bullish takeover is possible shortly. Therefore, the technical indicators reflect a possible bullish reversal in the ENJ coin price. Upcoming Trend The ENJ coin price takes support in the long-coming falling wedge pattern reflecting the possibility of a bullish reversal to touch the resistance trendline. Therefore, bullish traders can find entry spots at current prices. Buyers can target the $2 and $2.15, coinciding with the 200-day EMA as upcoming targets. However, a sudden jump in selling pressure will drive the price lower to the $1.15 mark. At the time of writing, TradingView analyzes the 4-hour chart of ENJ and gives a “NEUTRAL” signal. Technical Analysis for ENJUSD
The post ENJ Technical Analysis: Reversal Within Wedge Brings Buyers Back appeared first on Cryptoknowmics-Crypto News and Media Platform.
- "
- About
- Action
- analysis
- Assets
- bearish
- blockchain
- blockchain technology
- Bullish
- Coin
- Coins
- Current
- developers
- digital
- Digital Assets
- Display
- ecosystem
- EMA
- Enjin
- ERC-20
- ethereum
- Ethereum blockchain
- fallout
- FAST
- First
- forms
- game
- Games
- gaming
- HTTPS
- huge
- IT
- jump
- Level
- Line
- mark
- Media
- Metaverse
- Momentum
- move
- network
- news
- Offers
- Pattern
- performance
- platform
- Play
- pressure
- price
- Product
- Products
- Social
- sold
- support
- Target
- Technical
- Technical Analysis
- Technology
- time
- token
- touch
- Traders
- us
- value
- websites
- within
- writing